Results from the course “On Bridges, paths, and knots – create your own picturesque illustrations of graph theory”
Find a published paper, discussing the course and its results here.
Course Description
In 1736, the people of Königsberg wondered if there was a walk across all seven bridges in their city, crossing each bridge exactly once. The mathematician Leonhard Euler not only answered this question, but also created a new field of mathematics from it: graph theory. Today, it is used to describe traffic flows or calculate travel routes. The course gives an introduction to graph theory. This includes basic terms such as node, edge, and, of course, graph. With these simple definitions, amazingly complex theorems can be shown. Examples are the wedding lemma or why the "Haus des Nikolaus" can be drawn at all without putting down the pencil. Particular previous knowledge is not necessary. The participants of the course prepare in advance 20-minute lectures based on selected literature and present these contents in the course. The new terminology is explained with the help of specially designed examples. Afterwards, the participants work on tasks unknown to them in small groups and discuss their results in the course.
In order to contrast the purely scientific-theoretical approach up to this point, the second half of the course consists of a practical examination of the topic in the form of self-selected art or digital visualization projects. For inspiration, some participants give lectures on selected literature from the math-art sector. Examples of such work include Karl Katchee's Poppie Graphs or Christine von Renesse's investigation of Salsa Rueda using graph theory. The goal of the course is for all participants to each create their own representation of graph theory.
Artworks by the participants
In the following, we list all artworks that originated in the course. The original titles are given (with translation, where necessary). Each piece is accompanied by an artist statement, translation by the course supervisors.
Fraktale über Fraktale (Fractals over Fractals)
Maja Sixtbauer
Cubus Artis
Leo Sprengard
Ungewissheit (Uncertainty)
Mareike Pfeilsticker
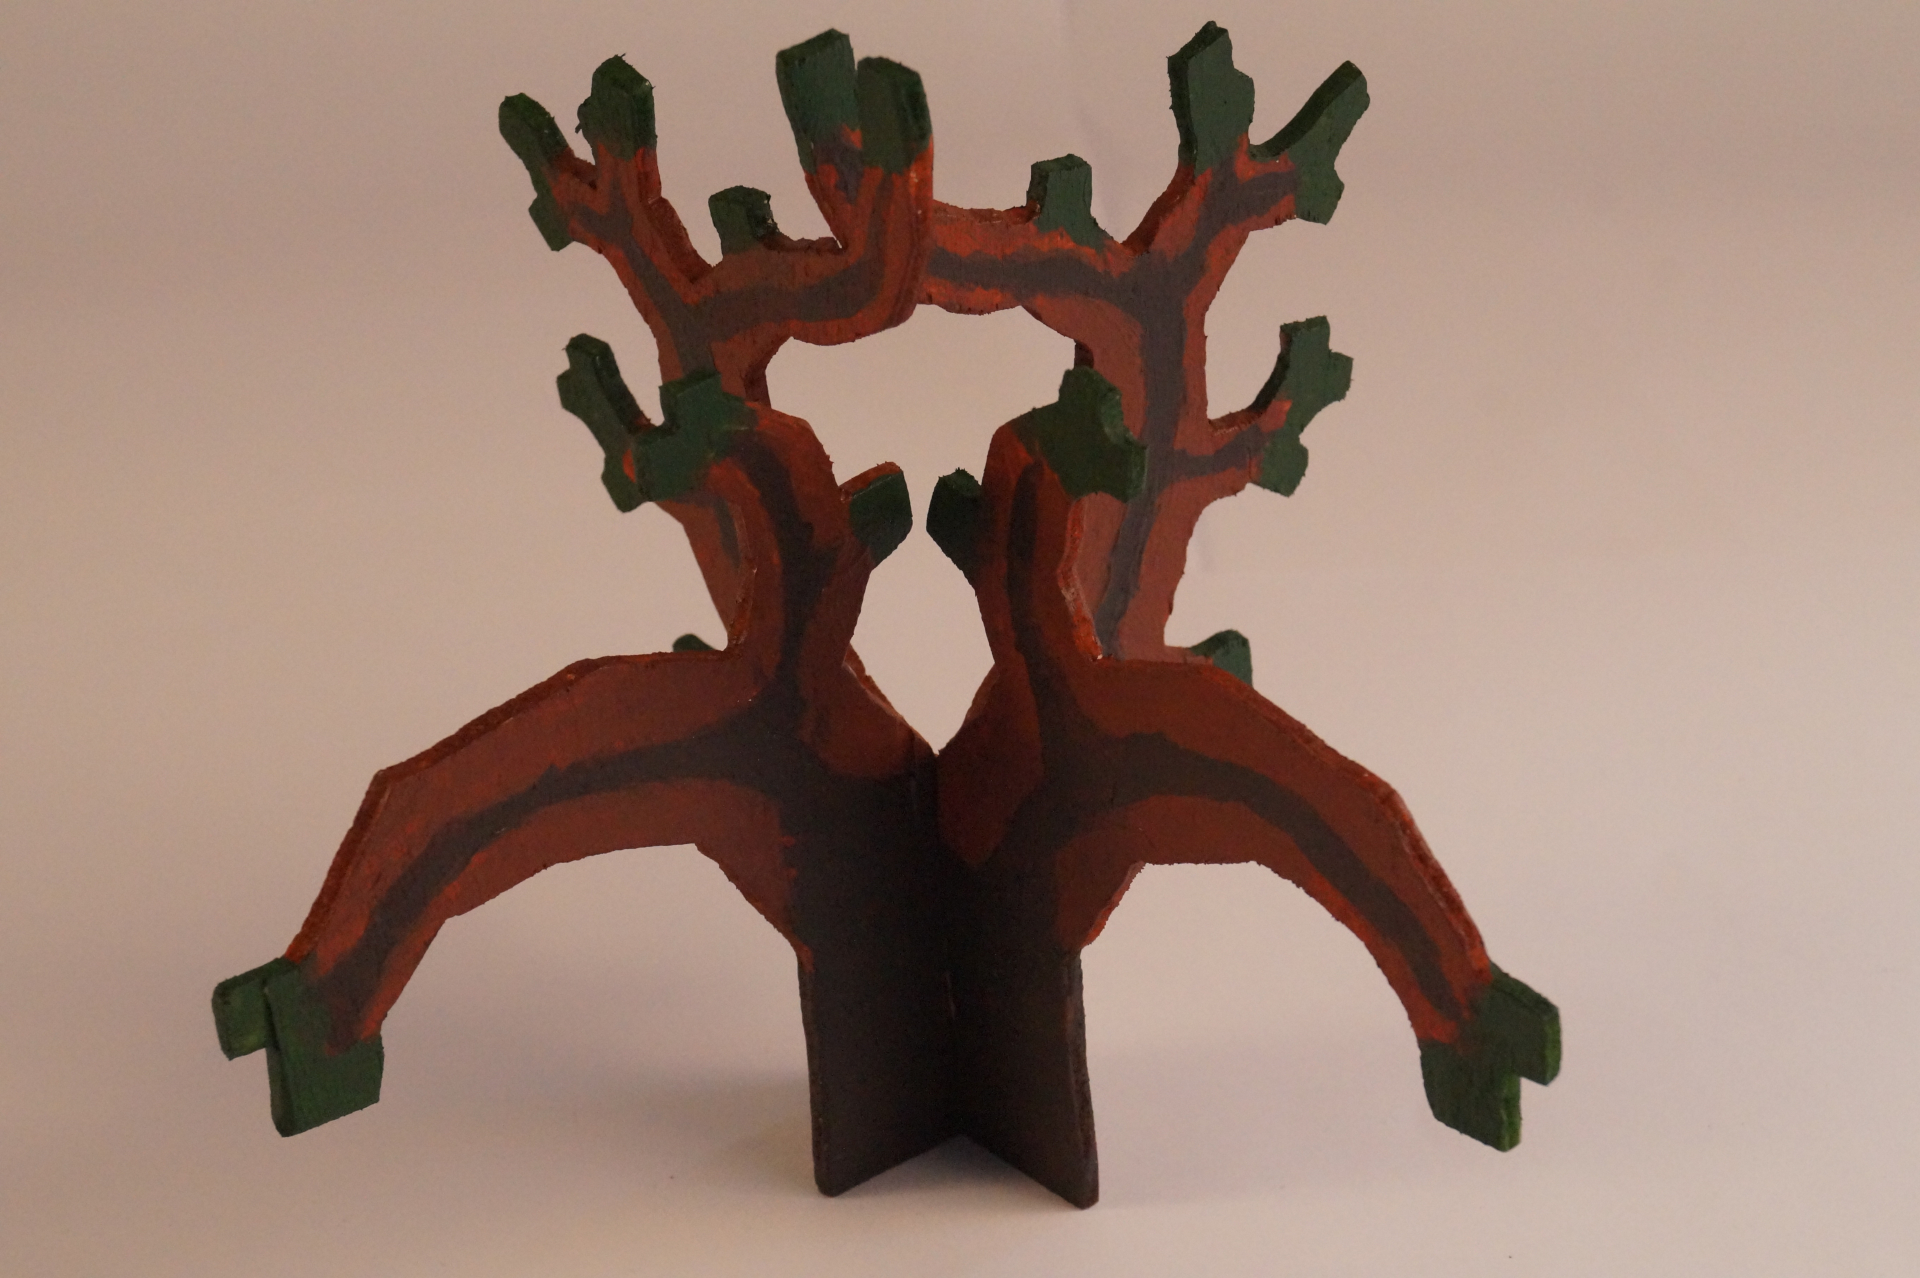
Baum aus Holz (Tree made of Wood)
Vesselin Matthiesen
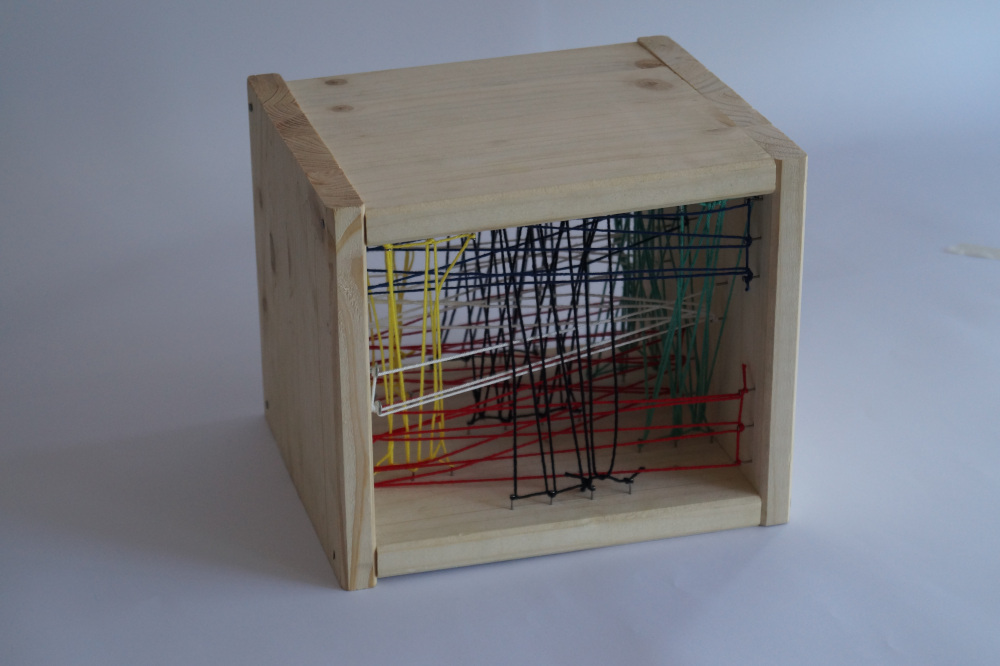
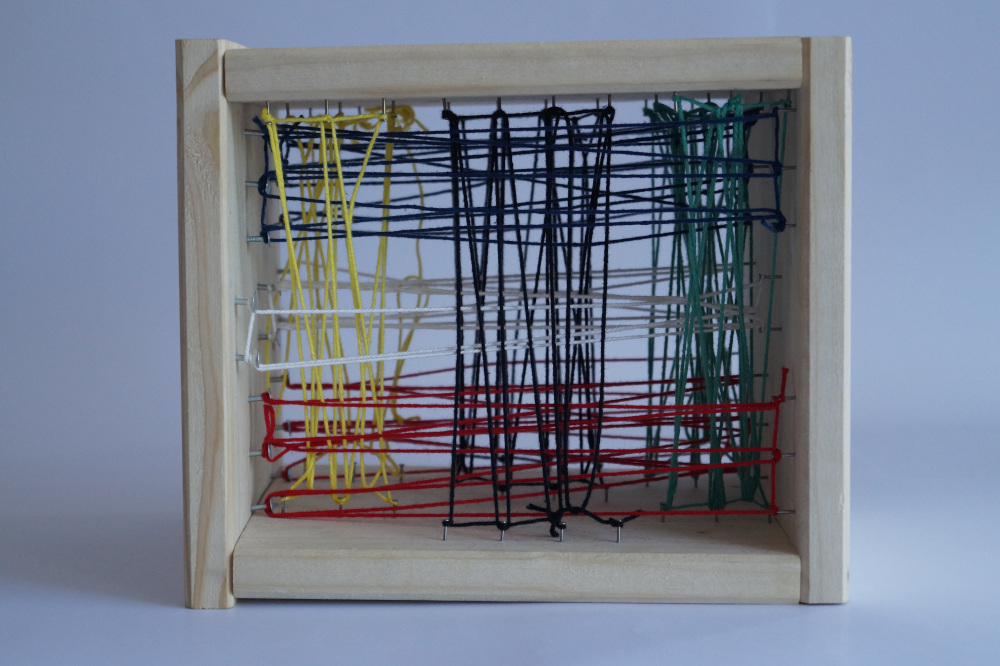
Gefangen in Angst und Einsamkeit (Caught in fear and loneliness)
Ira Hesse
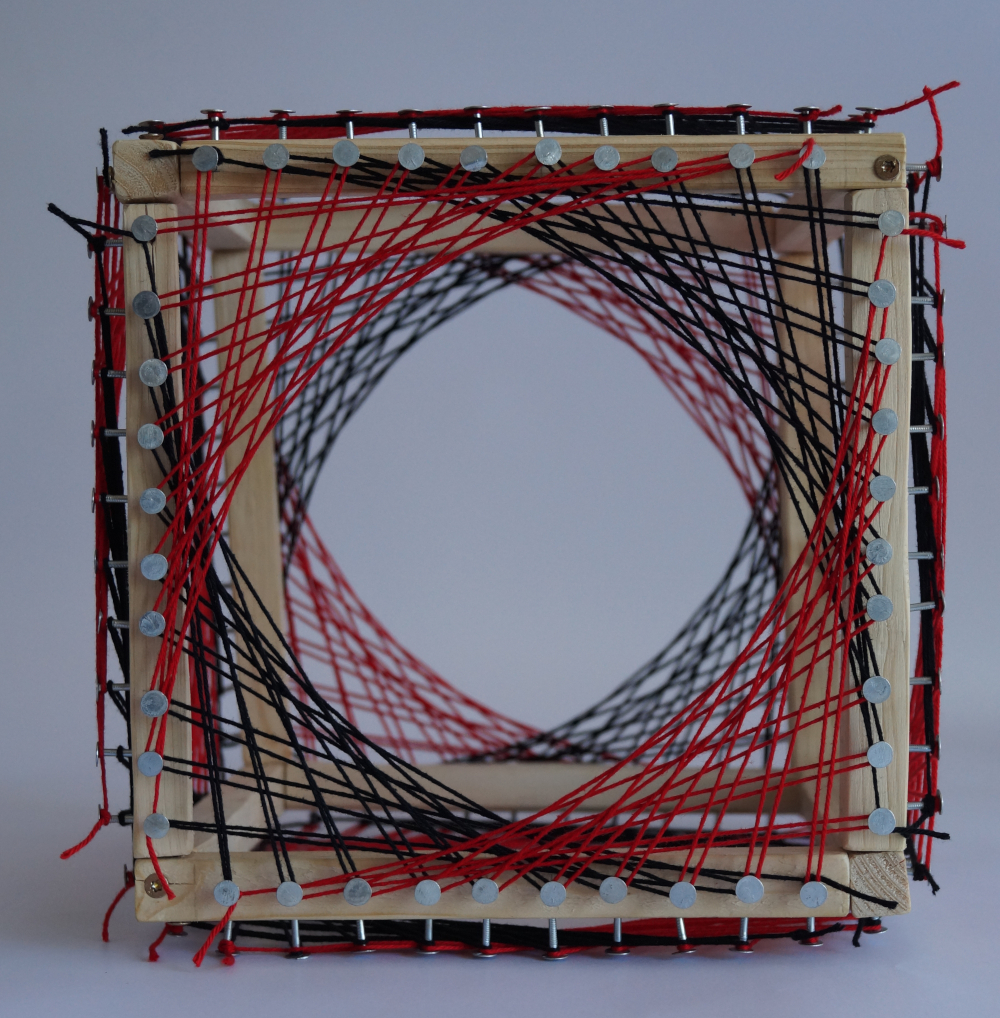
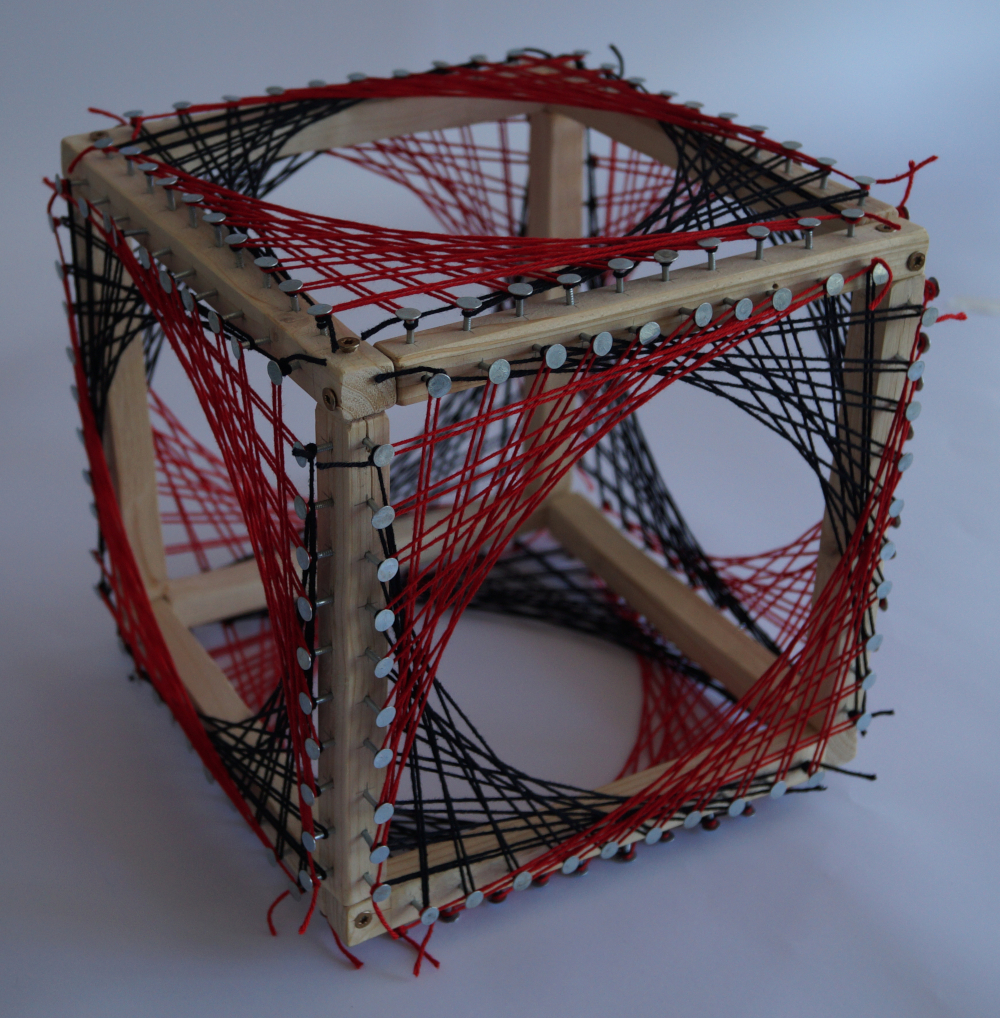
In the second half of the course I worked on my art project. After the process of brainstorming with the help of a poster, I decided to create something three-dimensional with string art. In the first step, I made several sketches and visualized my idea using the visualization program GeoGebra5. Planning as accurately as possible went on in measuring the pieces of wood, which I then cut out using a jigsaw and subsequently sanded with a file to make the individual pieces of wood more pliable. After that, I hammered a total of 20 nails into each piece of wood, equally spaced on two sides of the surface. After completing this step, the total of twelve edges were screwed together to form the platonic body of a hexahedron after predrilling.
The last step consisted of stretching four cotton threads – two each in black and red - around the nails for each side surface to create a pattern. In terms of graph theory, we can say that each nail represents a corner and the taut threads represent edges between those, with each individual thread representing a connected, bipartite graph. Altogether, this creates a net that stretches around the cube, appropriating and constricting it. The colors red and black provide a strong contrast to each other and make the object appear rather somber. This supports the effect of being of being trapped and evokes an uneasy tension.
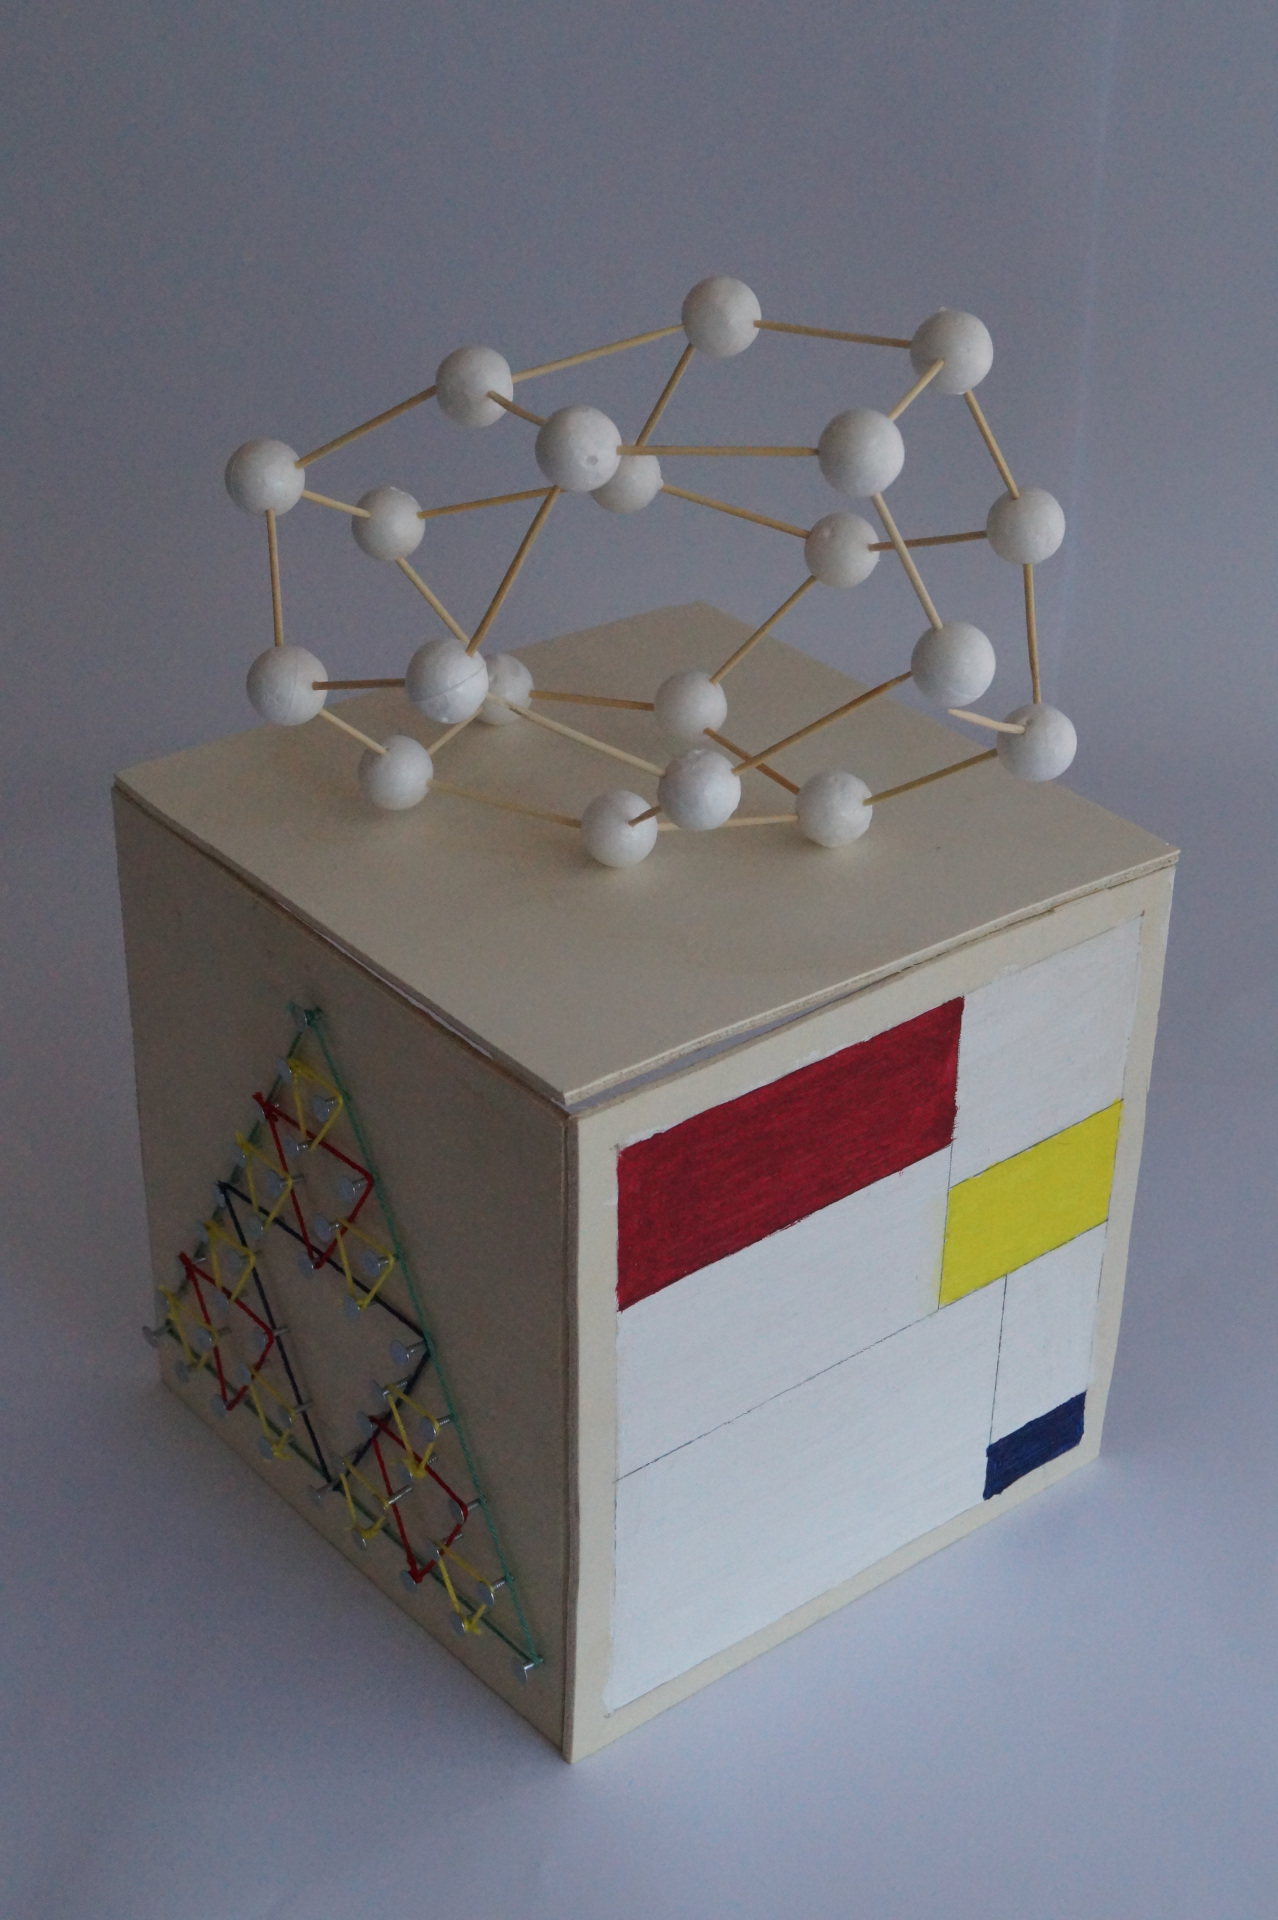
3BiT – Baumspirale (3BiT – Treespiral)
Nolan Emilio Muniz Fernandez
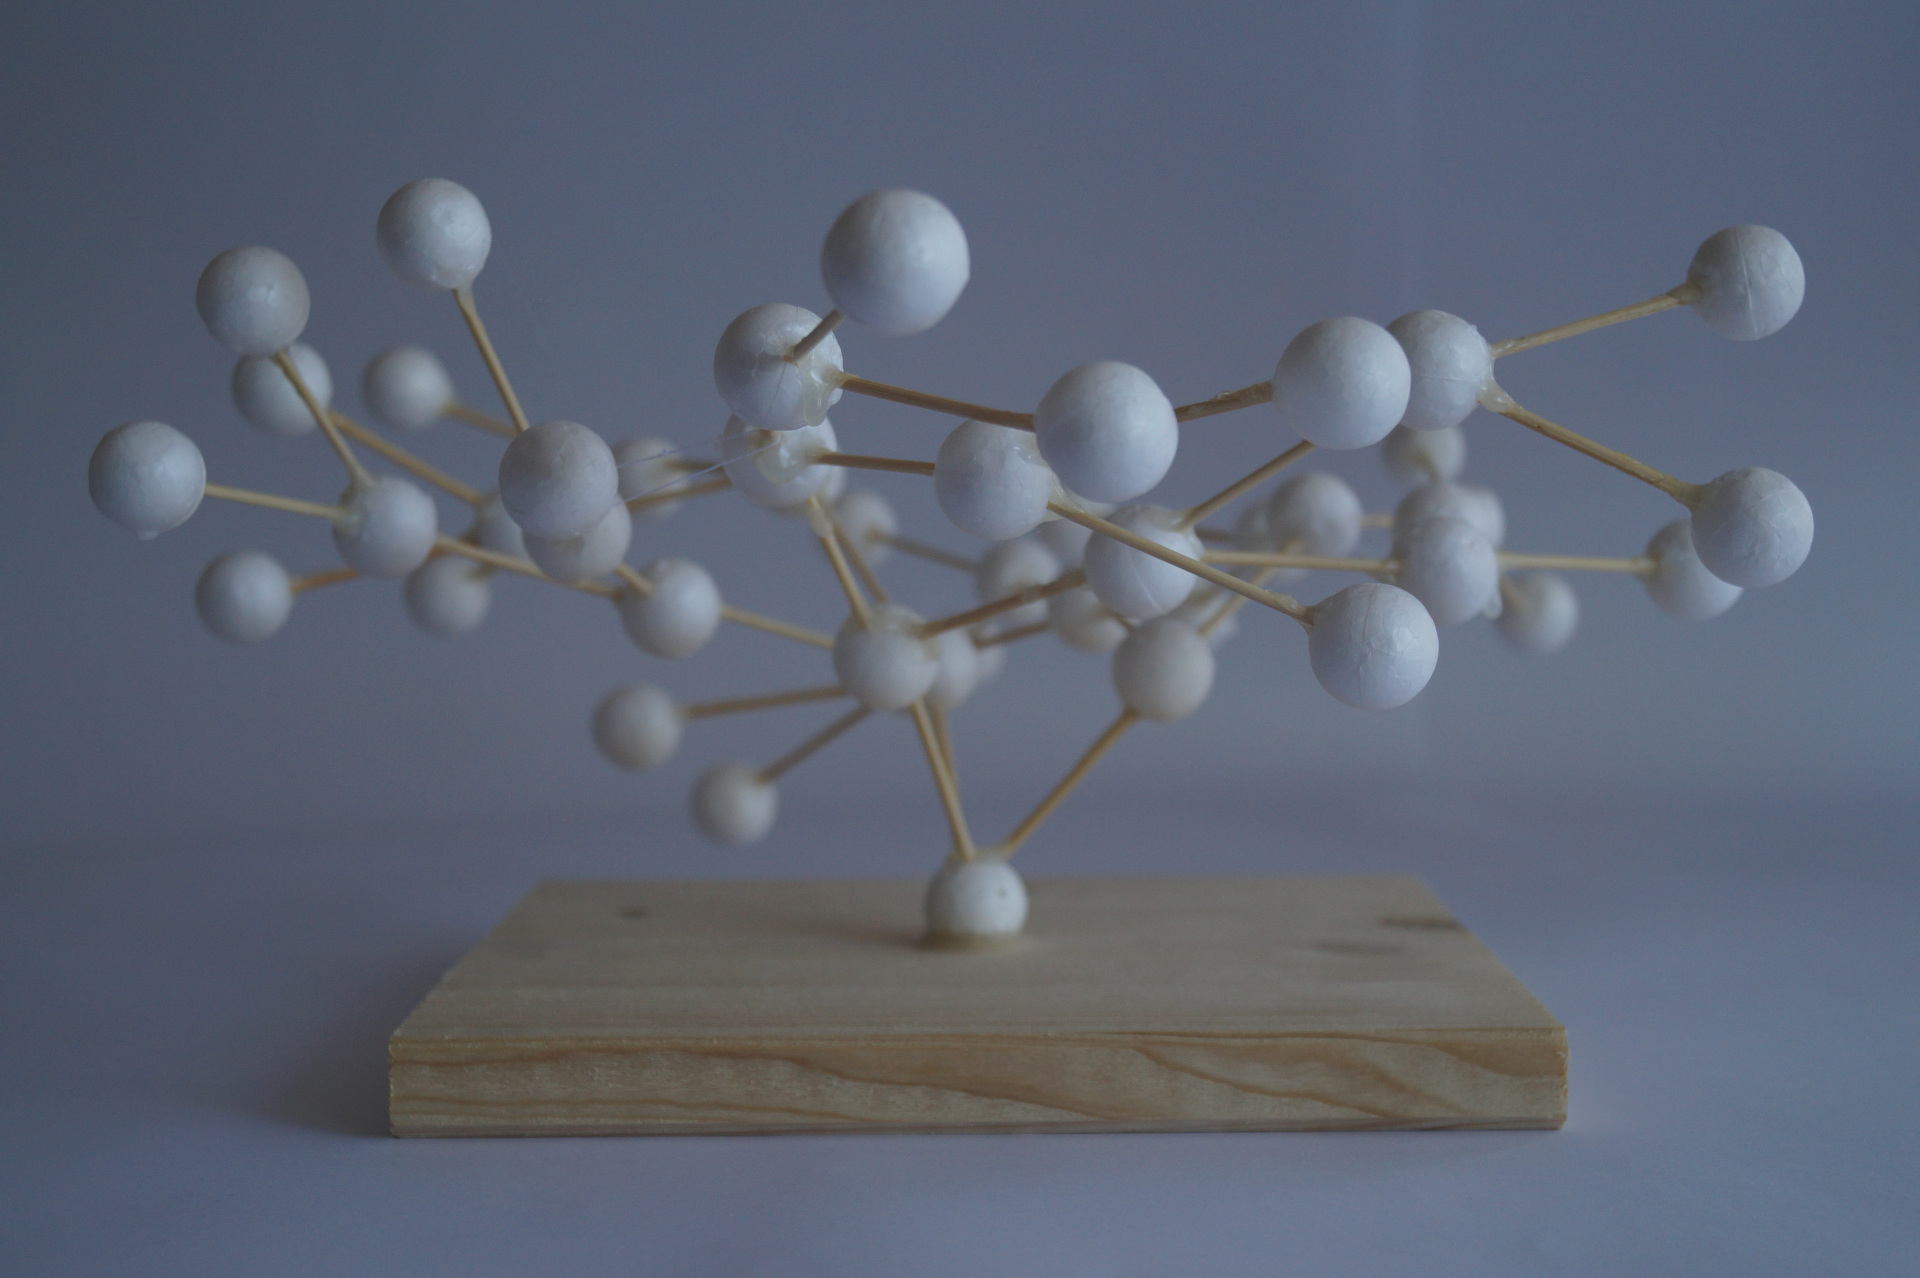
How can a tree look like a spiral in 3 dimensions? This is the question I wanted to find out with my project based on an example. However, the project should look realistic, which is why I tried to imitate a tornado or a water vortex.
In the end, I decided not to program my project, but to build it. For this, I used Styrofoam balls and toothpicks, which I mounted on a wooden base. In addition, I used thread to stabilize the tree and maintain the spiral shape until I had completed all the connections between the toothpicks and the balls. I was able to fix all connections between toothpicks and balls with hot glue. The dimensions are 16 cm × 38 cm × 31 cm.
However, I had the problem that my tree spiral in the upper levels very quickly thinned out and lost density. This is where the meaning of "3BiT" comes into play. Since the density was too low, I decided to merge several binary trees at a root and so I got my 3 binary trees in a tertiary tree – tree spiral. obtained.
Overall, my project really resembles a vortex when completed. Similarities I see I see more in a tornado, because it is bigger and more irregular and fits more to the rough structure of my project. In contrast, a whirlpool is very regular and too uniform to resemble my 3BiT – tree spiral.
Stella botanica residua
Tim A. Burdack
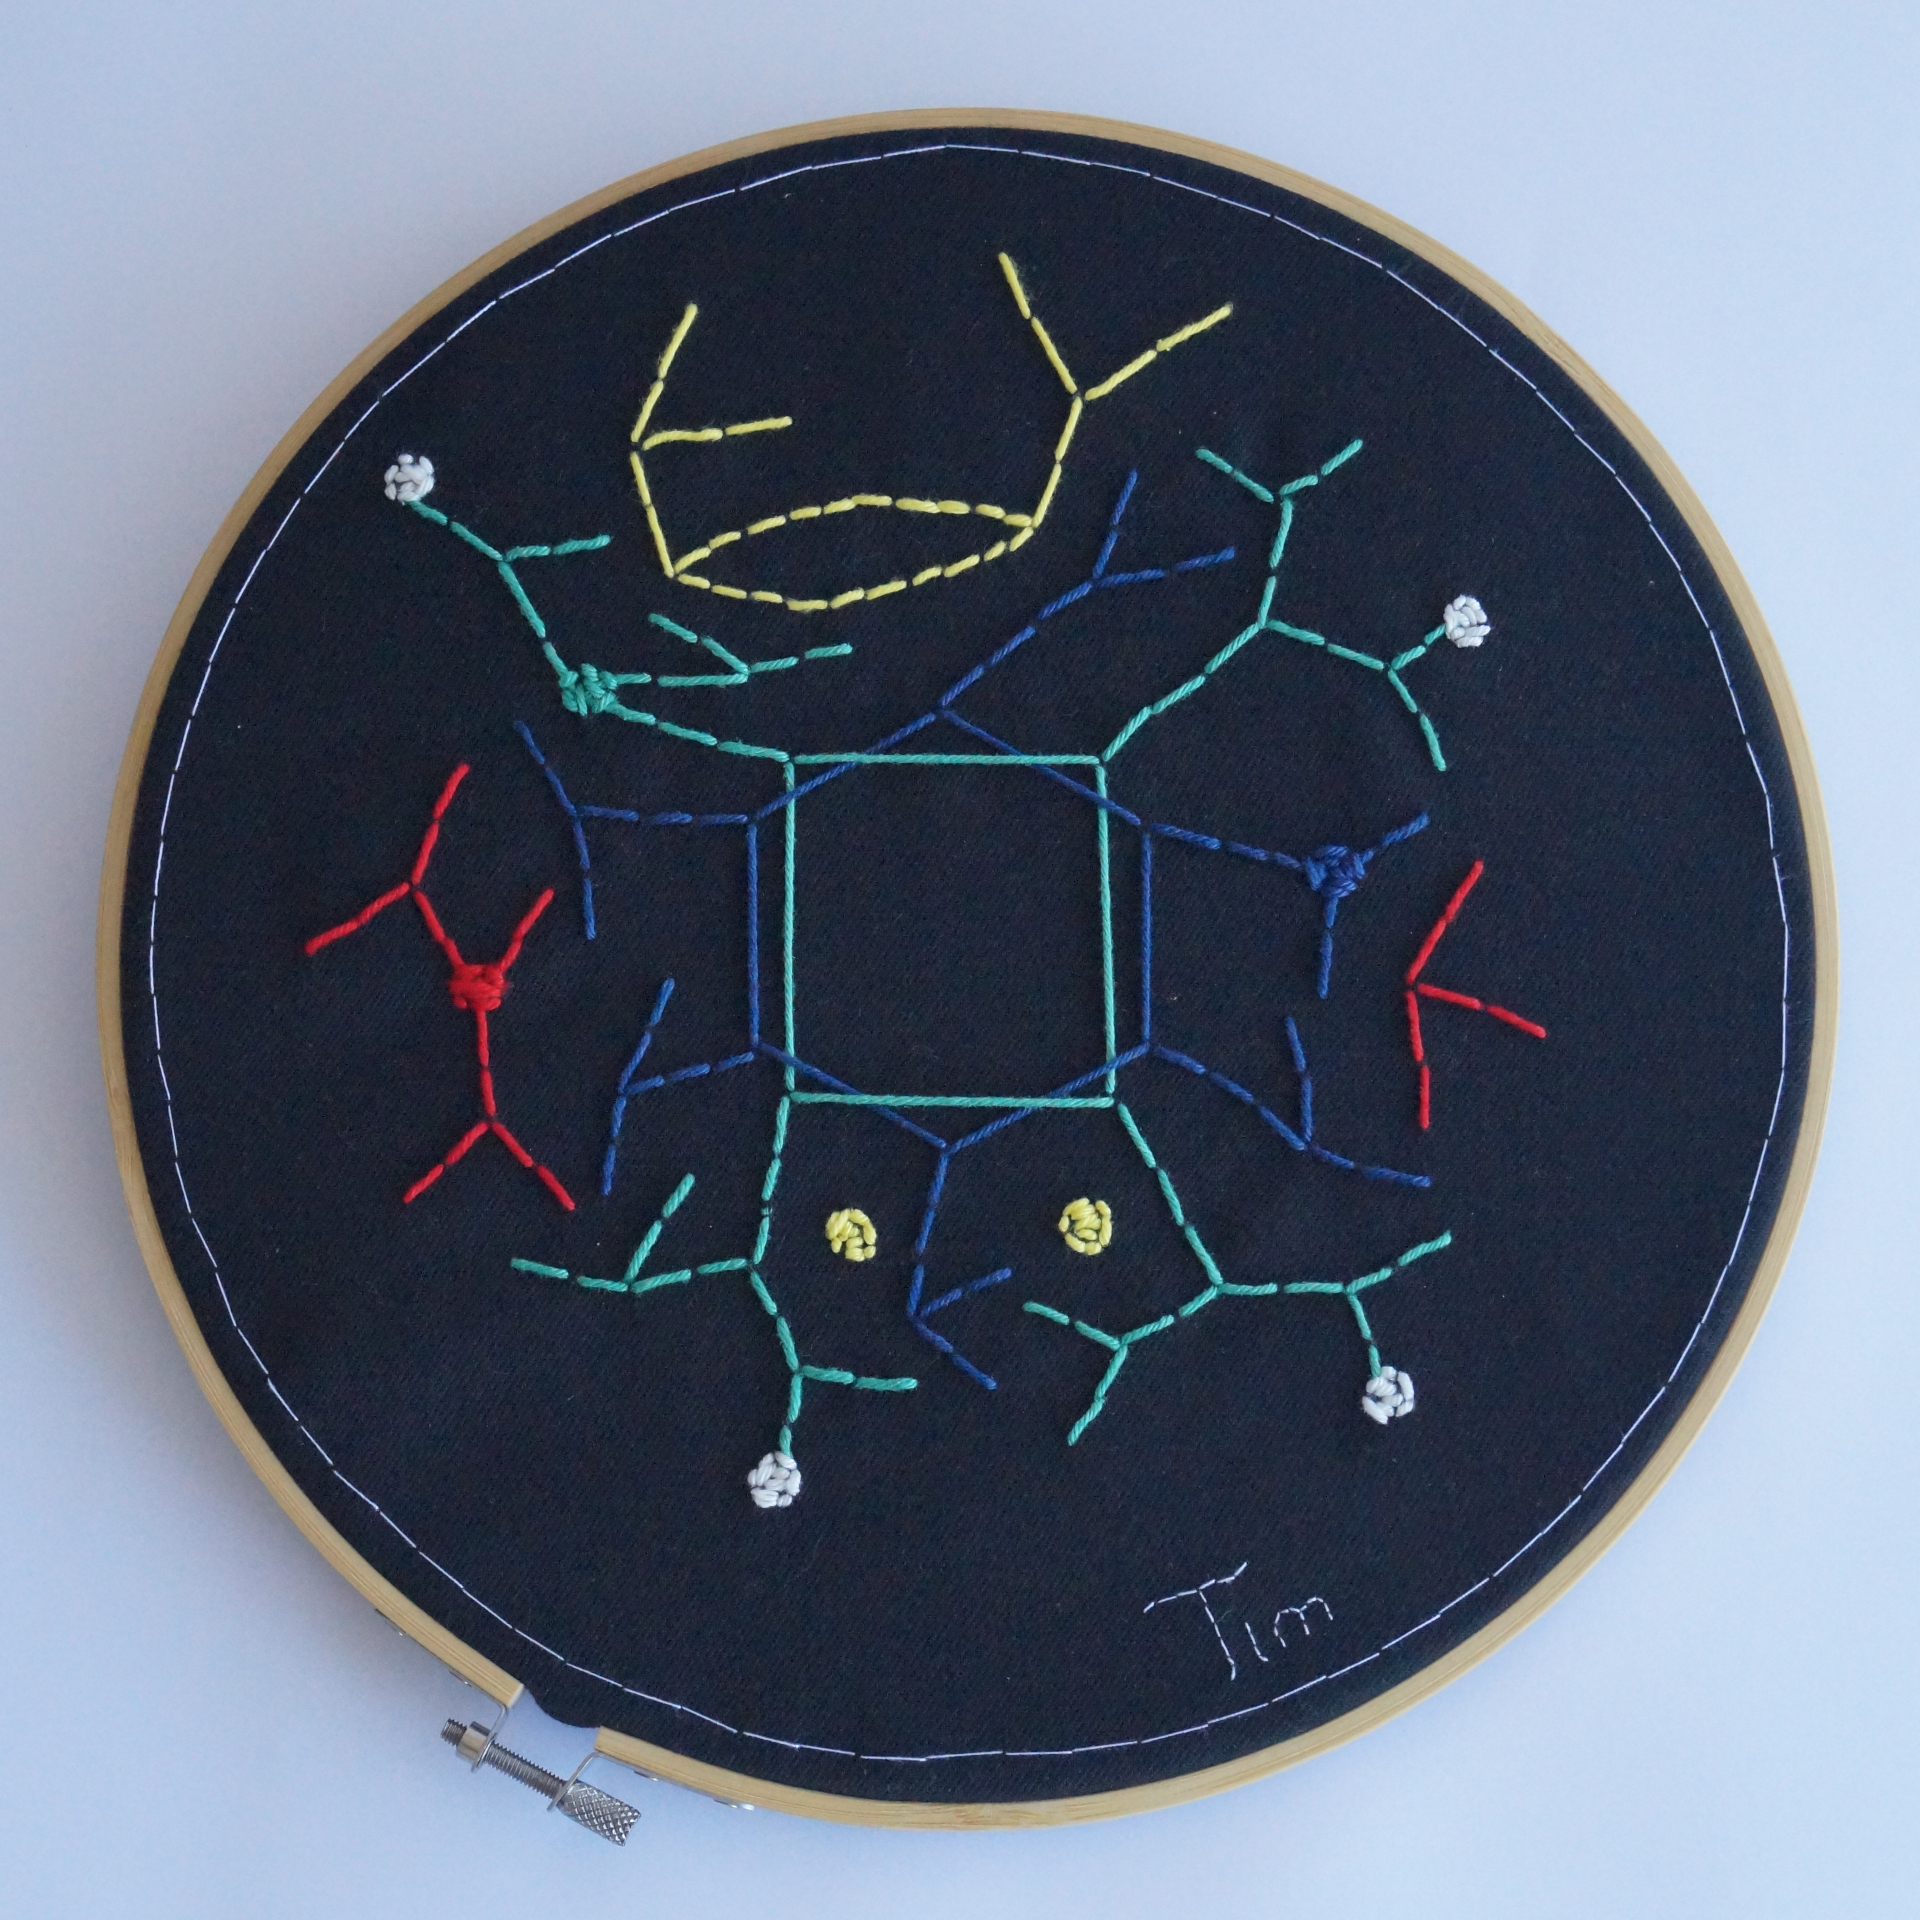
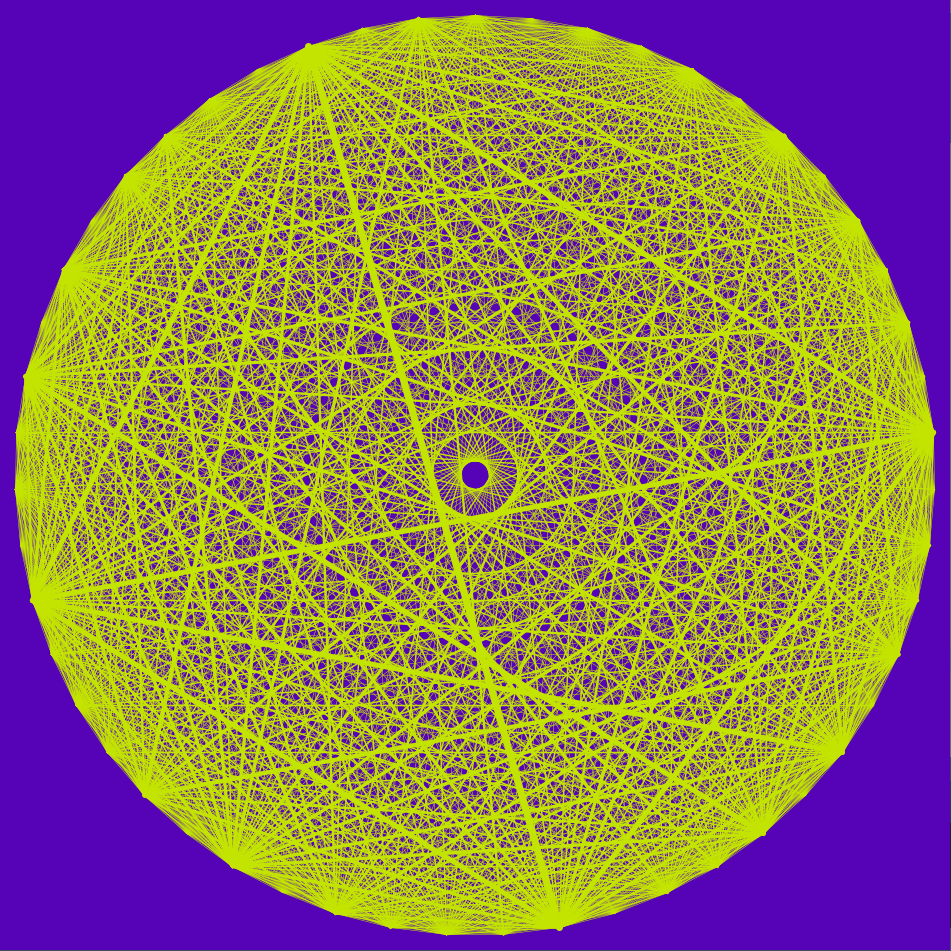
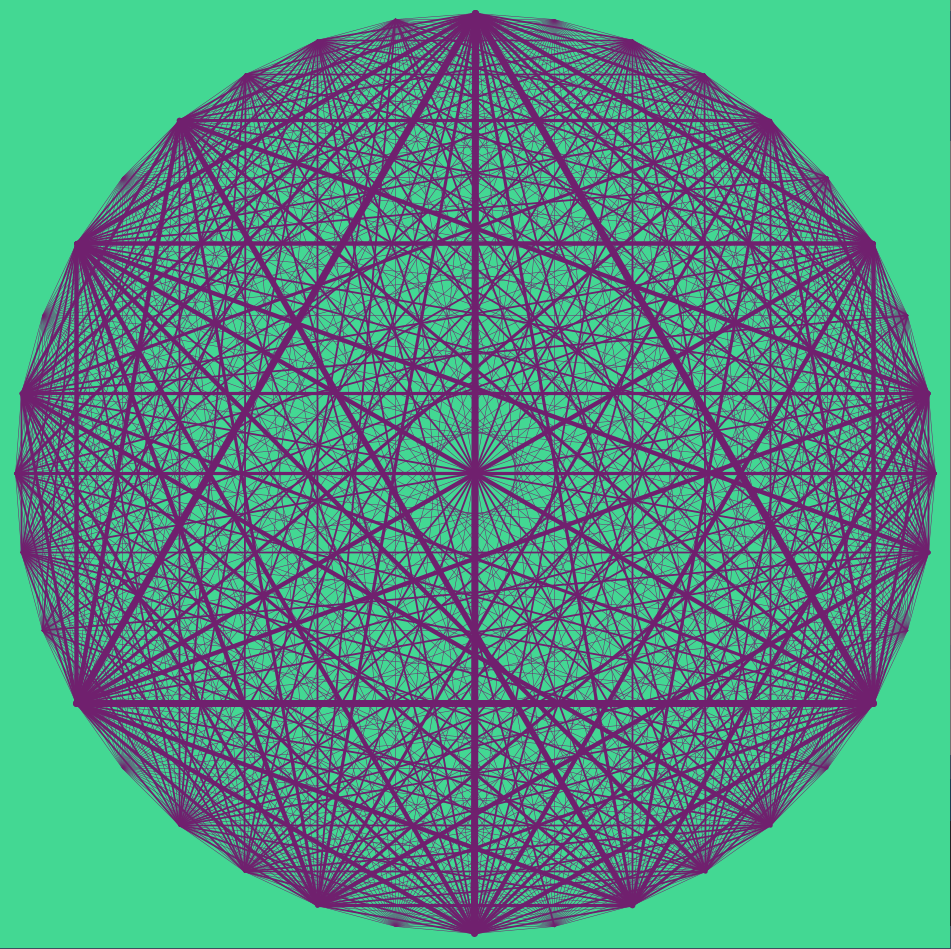
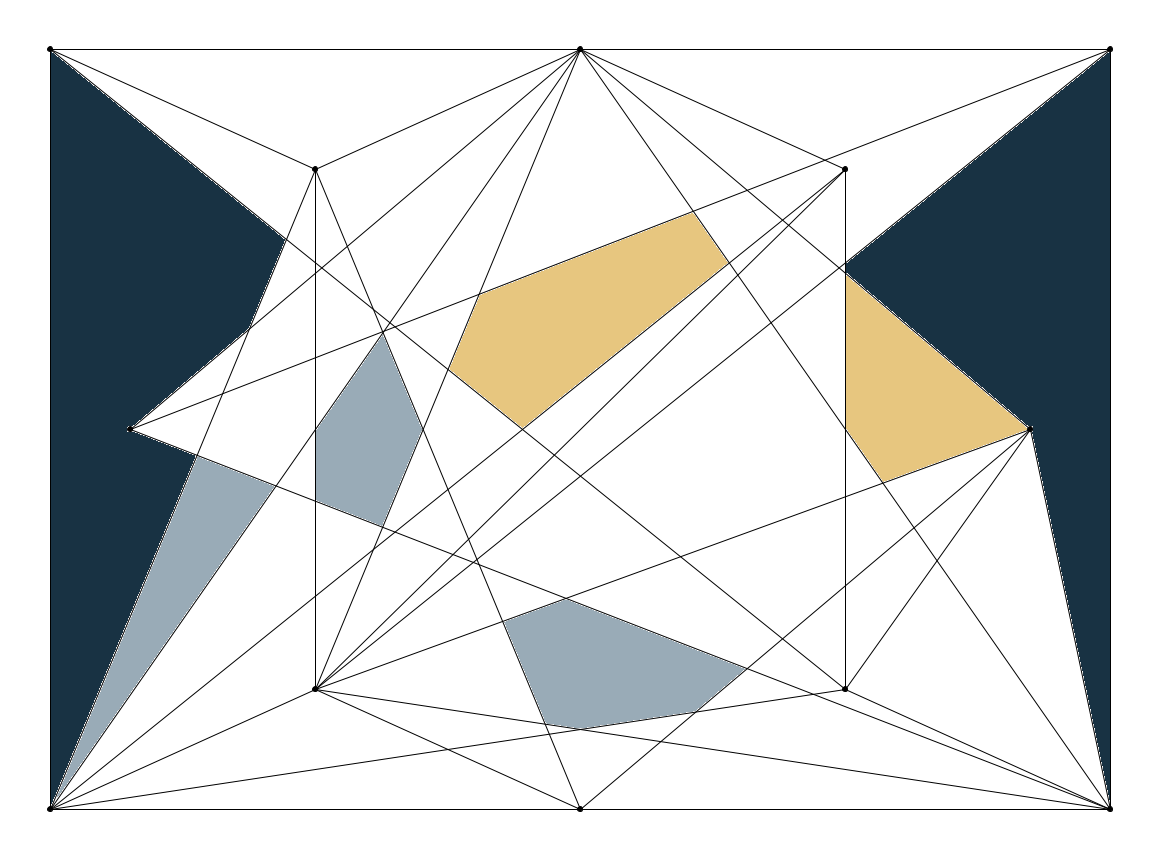
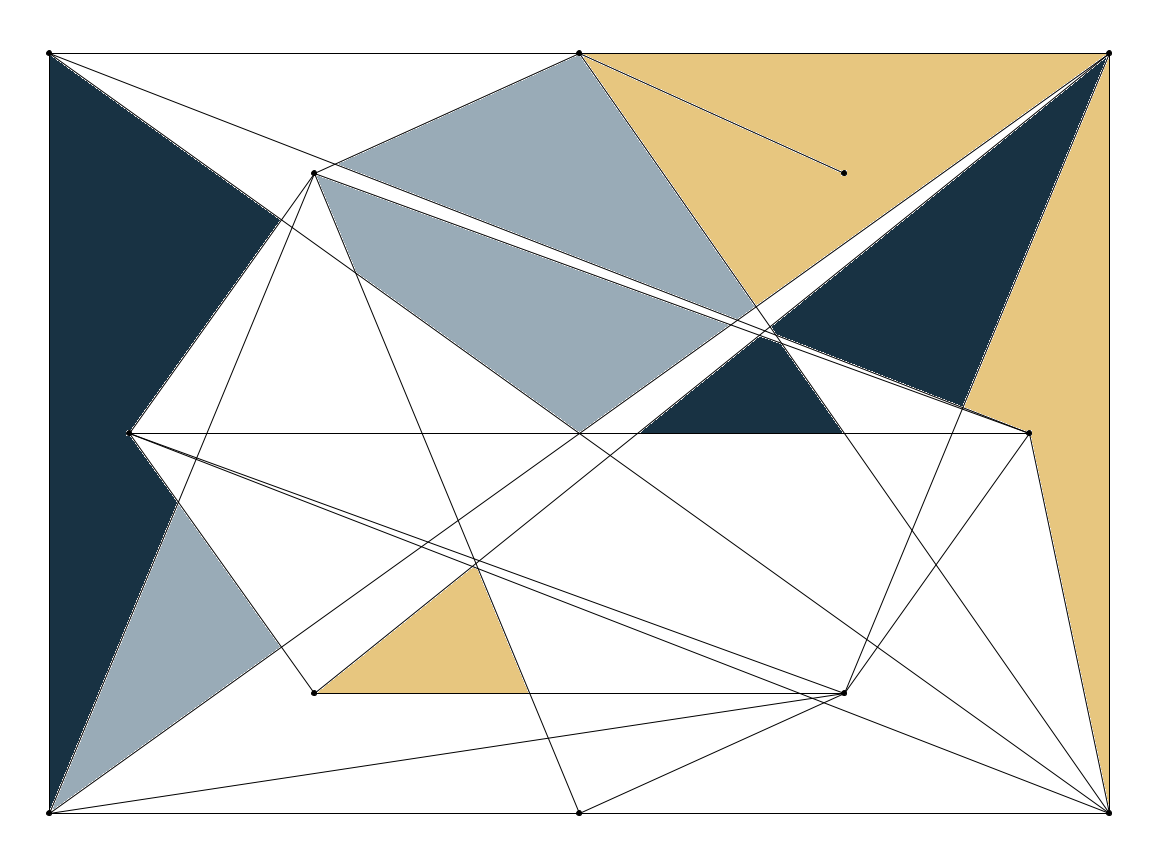
An approach that produces graphs whose structure is backed by a certain pattern and which lend themselves to artistic representation has its origins in number theory. In previous work, graphs of the following form are treated: For n∈N let Dn:=(Vn, En) be the directed graph with vertex set Vn:={0, 1, ..., n-1} and for x,y∈Vn let (x,y)∈En hold exactly if y≡x2 (mod n). For the concrete implementation, I chose particular moduli n, for which I consider the corresponding graphs Dn, whose components and vertices are interlockingly combined and arranged in such a way that an artistic representation of the graphs results. In the practical execution, these graphs are then embroidered with colored threads on a black cloth. For example, different colors can be chosen for different modules or components, or certain corners of the graphs can be highlighted by representing them as circles of different sizes.
I chose the prime numbers 37 and 41 as moduli. The corresponding graphs have four and three components, respectively. The cycles of the largest components, a hexagon and a quadrilateral, are to form the center of the work. The remaining corners and edges of these components shall surround the remaining components, which are placed at the edges of the work. This is to result in a plant-like structure, with flowers representing the outer components.
The completed artwork, shall be titled "Stella botanica residua", because when looking at the work, the individual components of the graphs may also seem like constellations (lat. stella). The remaining components of the title result from the structure of a plant (botanica) and the number-theoretical background (residua).
Strobo Mandalas
Jana Reich
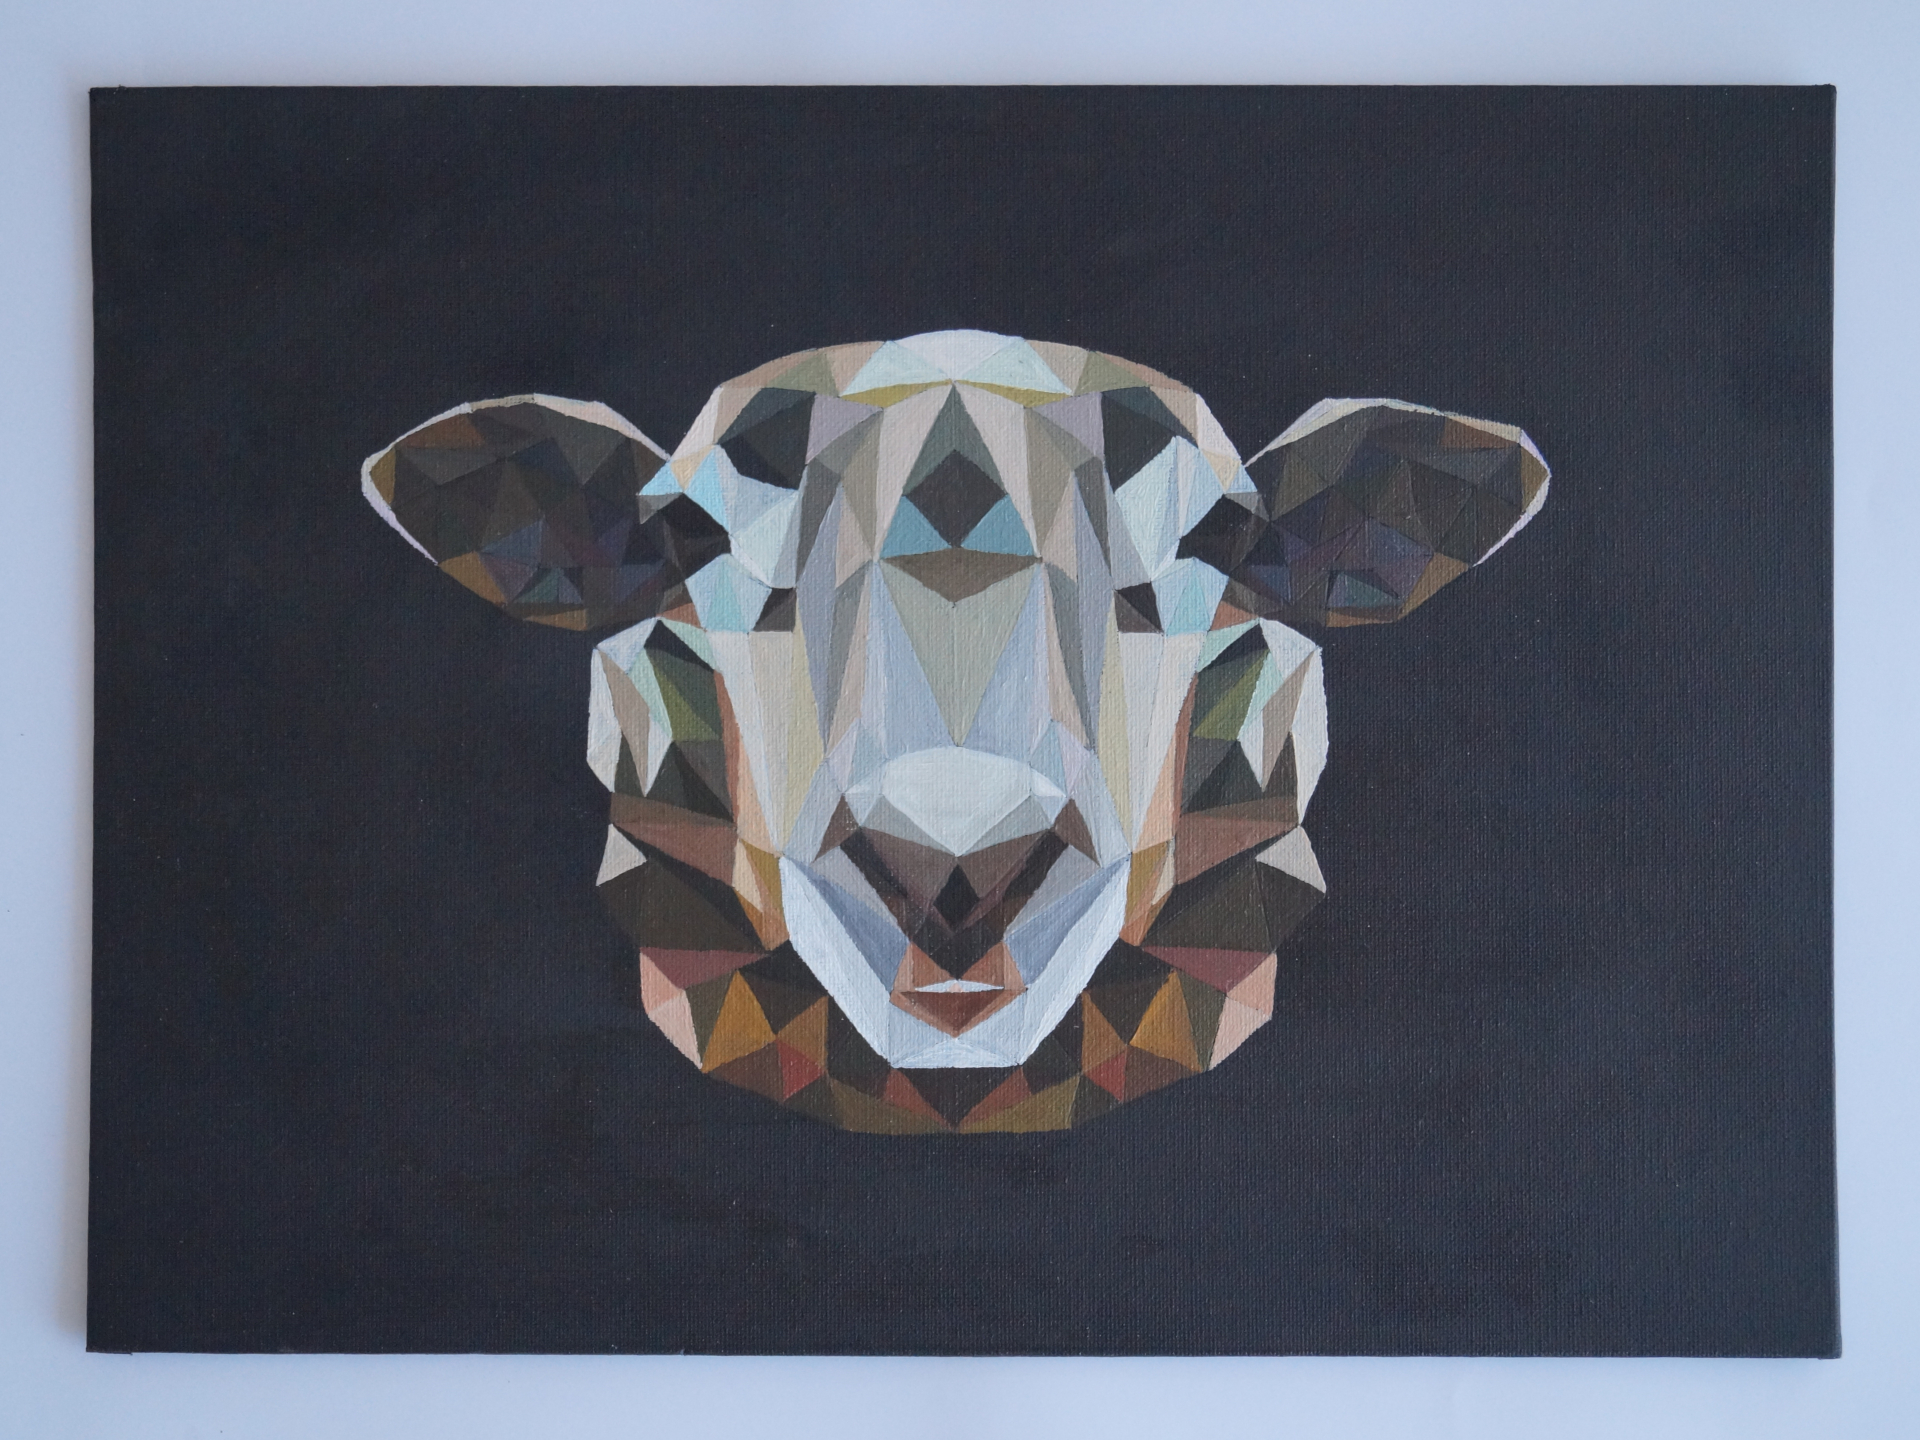
Graf-Schaph (Count of Sheeph)
Jana Reich
Dreierlei Ecken (Three kinds of corners)
Paul Kästner
Distanzmatrizen von Tertiärbäumen (Distance matrices of terniary trees)
Helen Anderl
Don’t PRESS the button
Sophie Pahmeyer
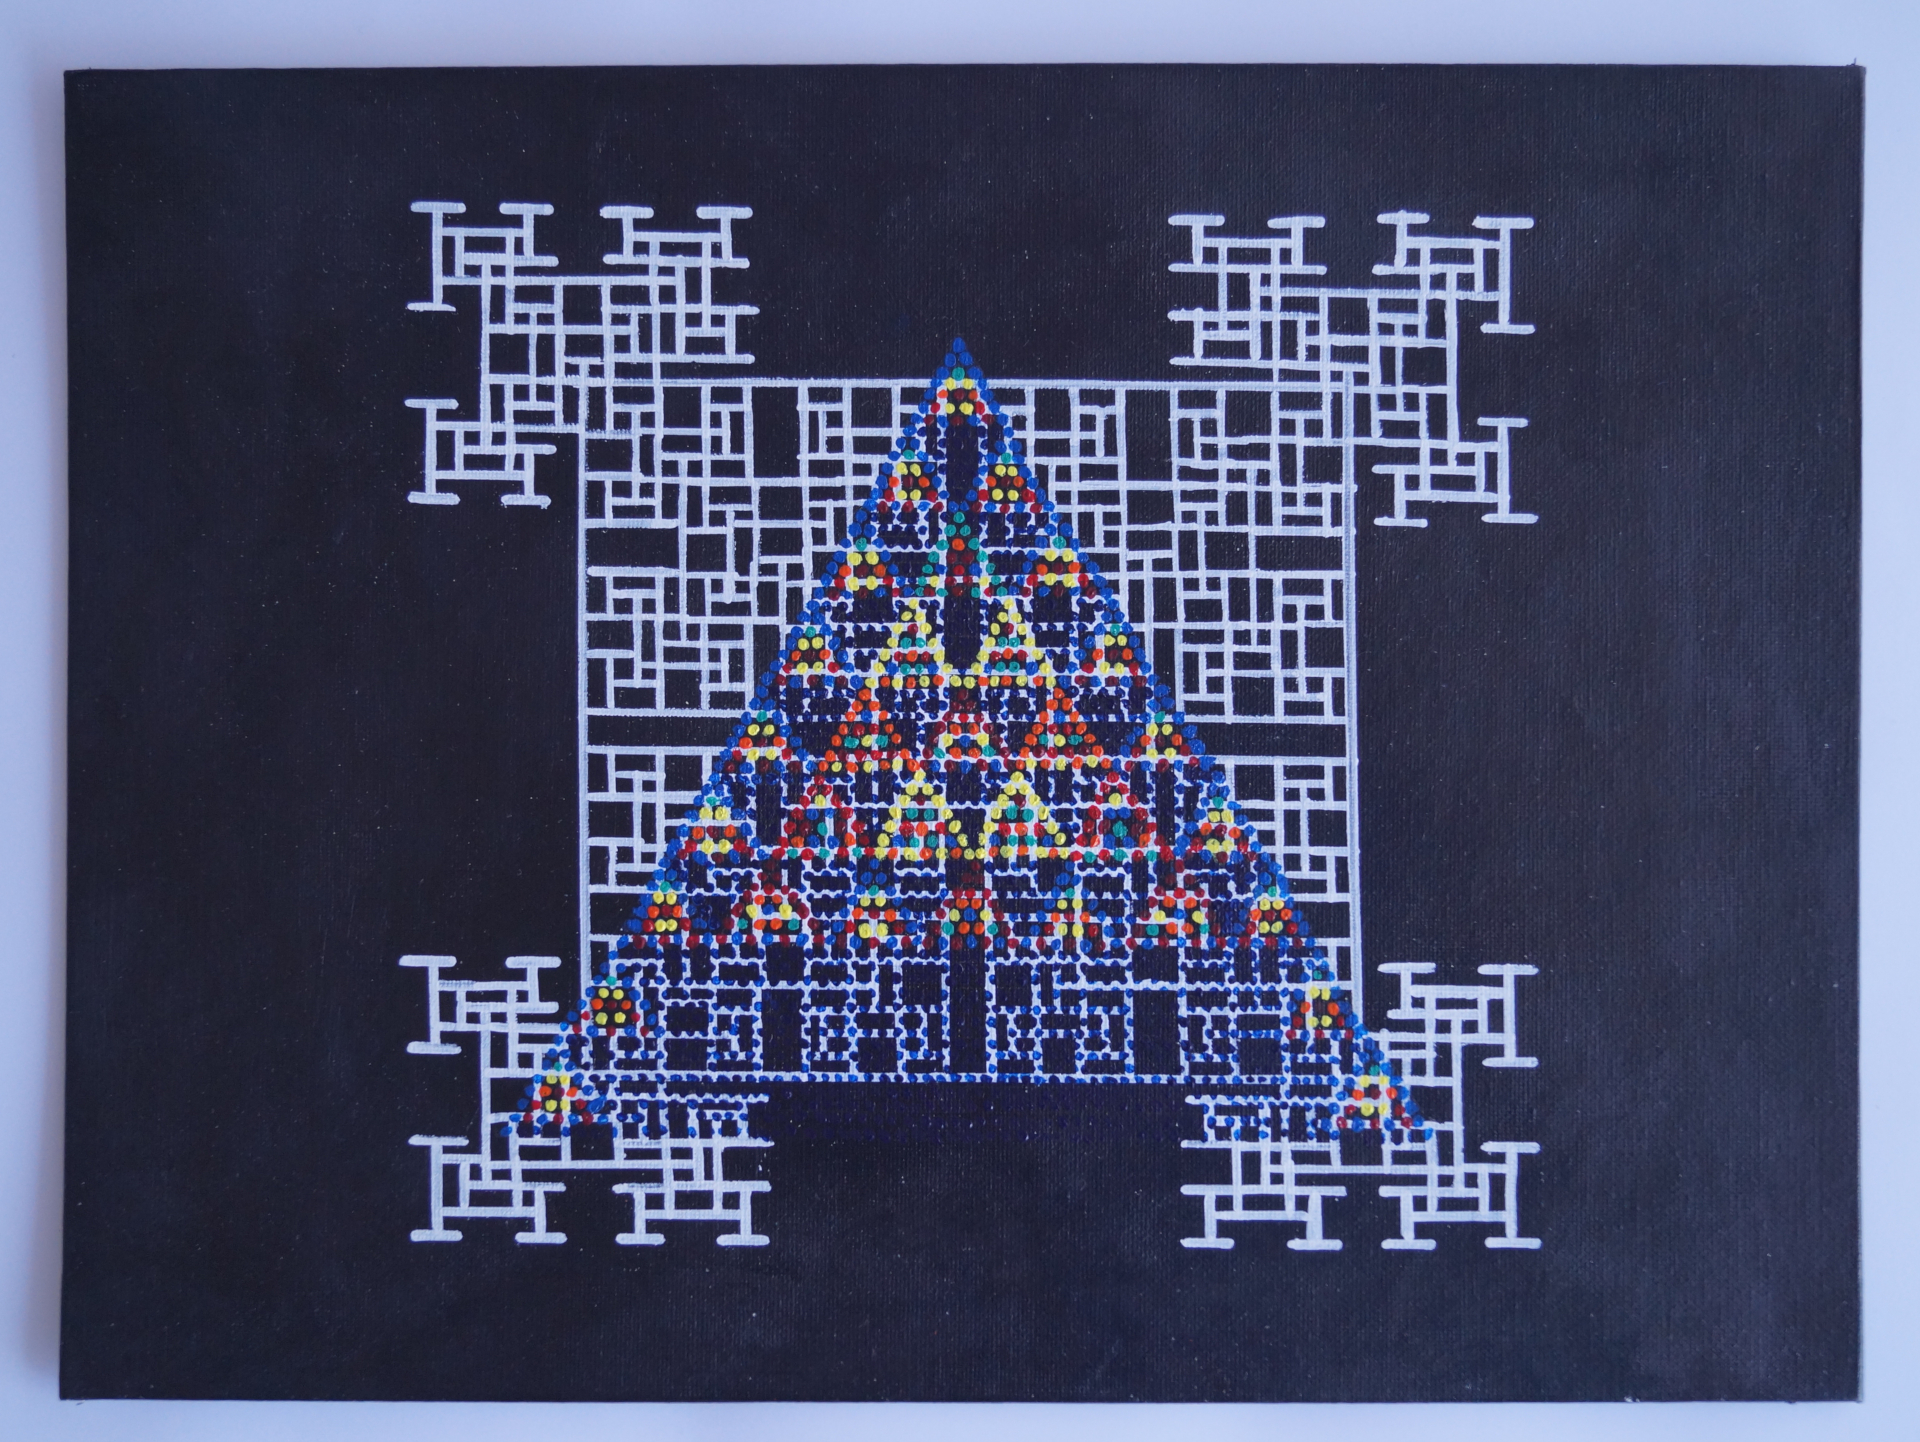
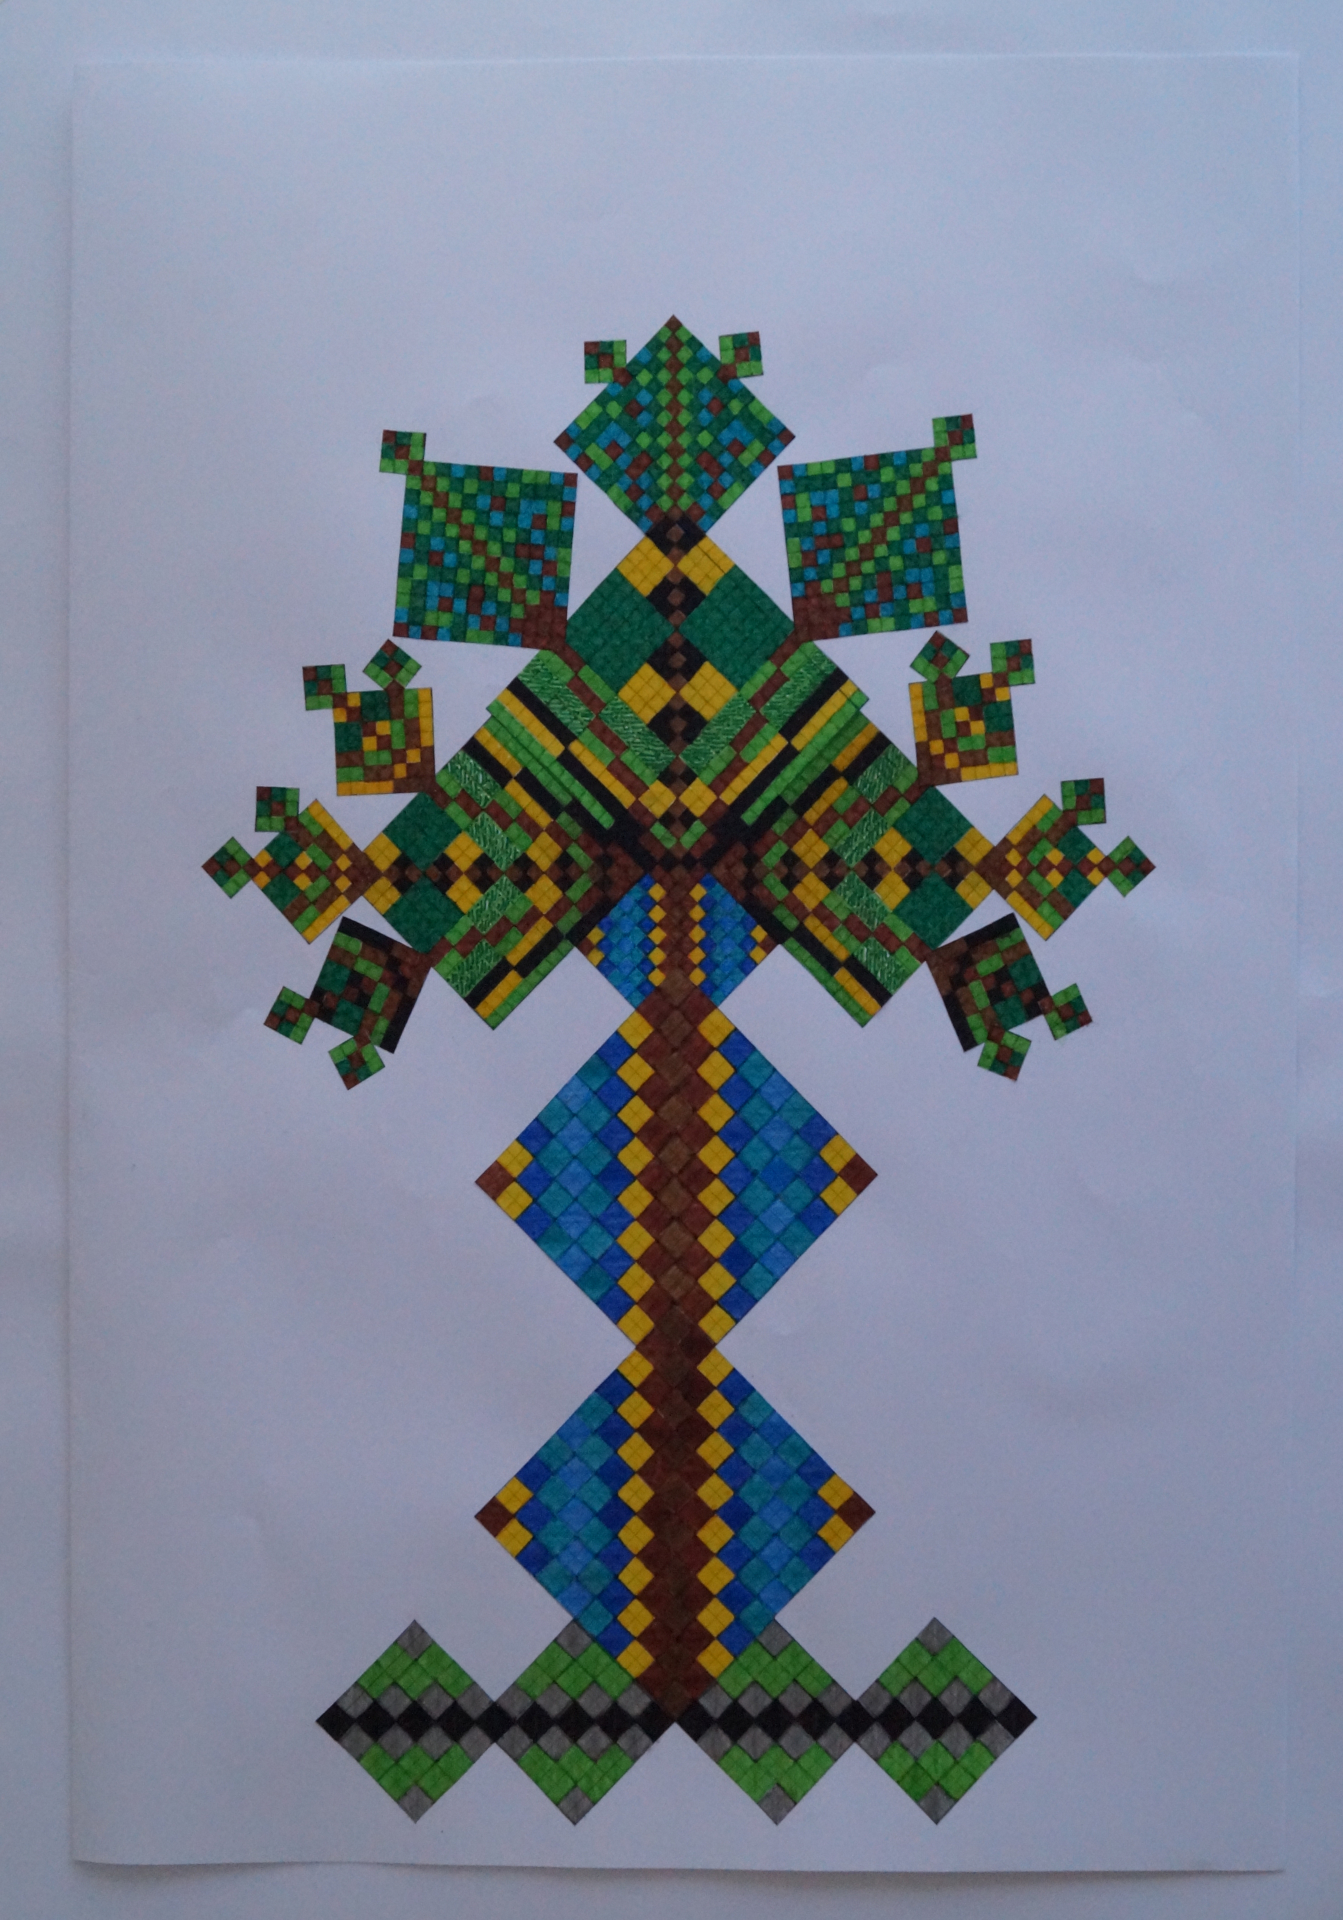
Grundfarben Pythagorasbaum (Primary color Pythagoras' tree)
Emilia Nebel
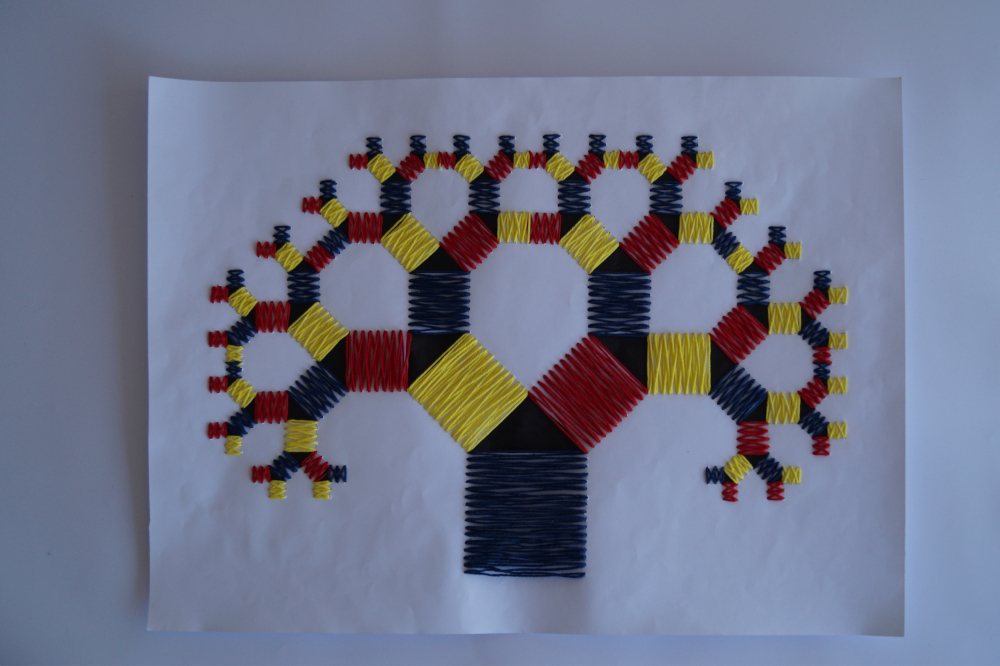
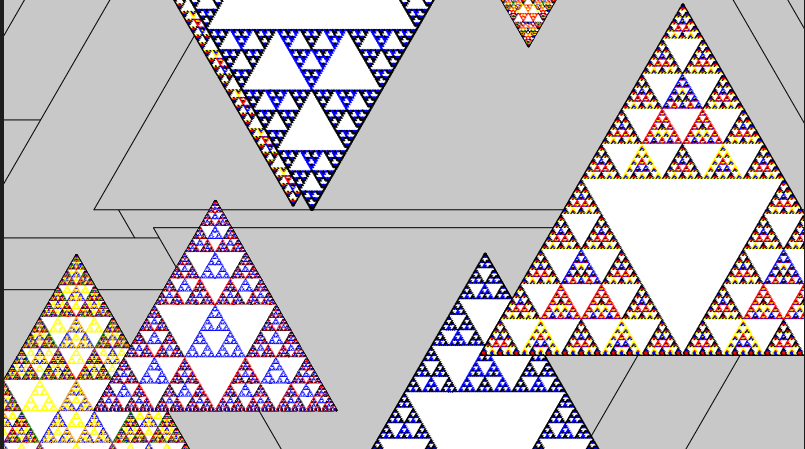
The basic concept of my project is based on a Pythagorean tree, which is an artistic elaboration of a binary tree. The tree I chose has six iterations, since the tree structure only then becomes really clear, see Figure 1.34. The triangles I used are equilateral, so that the tree is symmetrical. The squares are colored in the primary colors blue, yellow and red, whose arrangement around the triangles is reminiscent of a color circle in color theory. If you walk along any of the black colored triangles in one direction in the circle, you will notice that the order of the colors is always the same.
The project was created on a 50 cm × 37 cm drawing cardboard. The triangles are colored with acrylic paint and the squares are stitched with stitches each crossed with cotton, creating a bipartite graph for each square.
The Blue Boat
Luzi Soetje
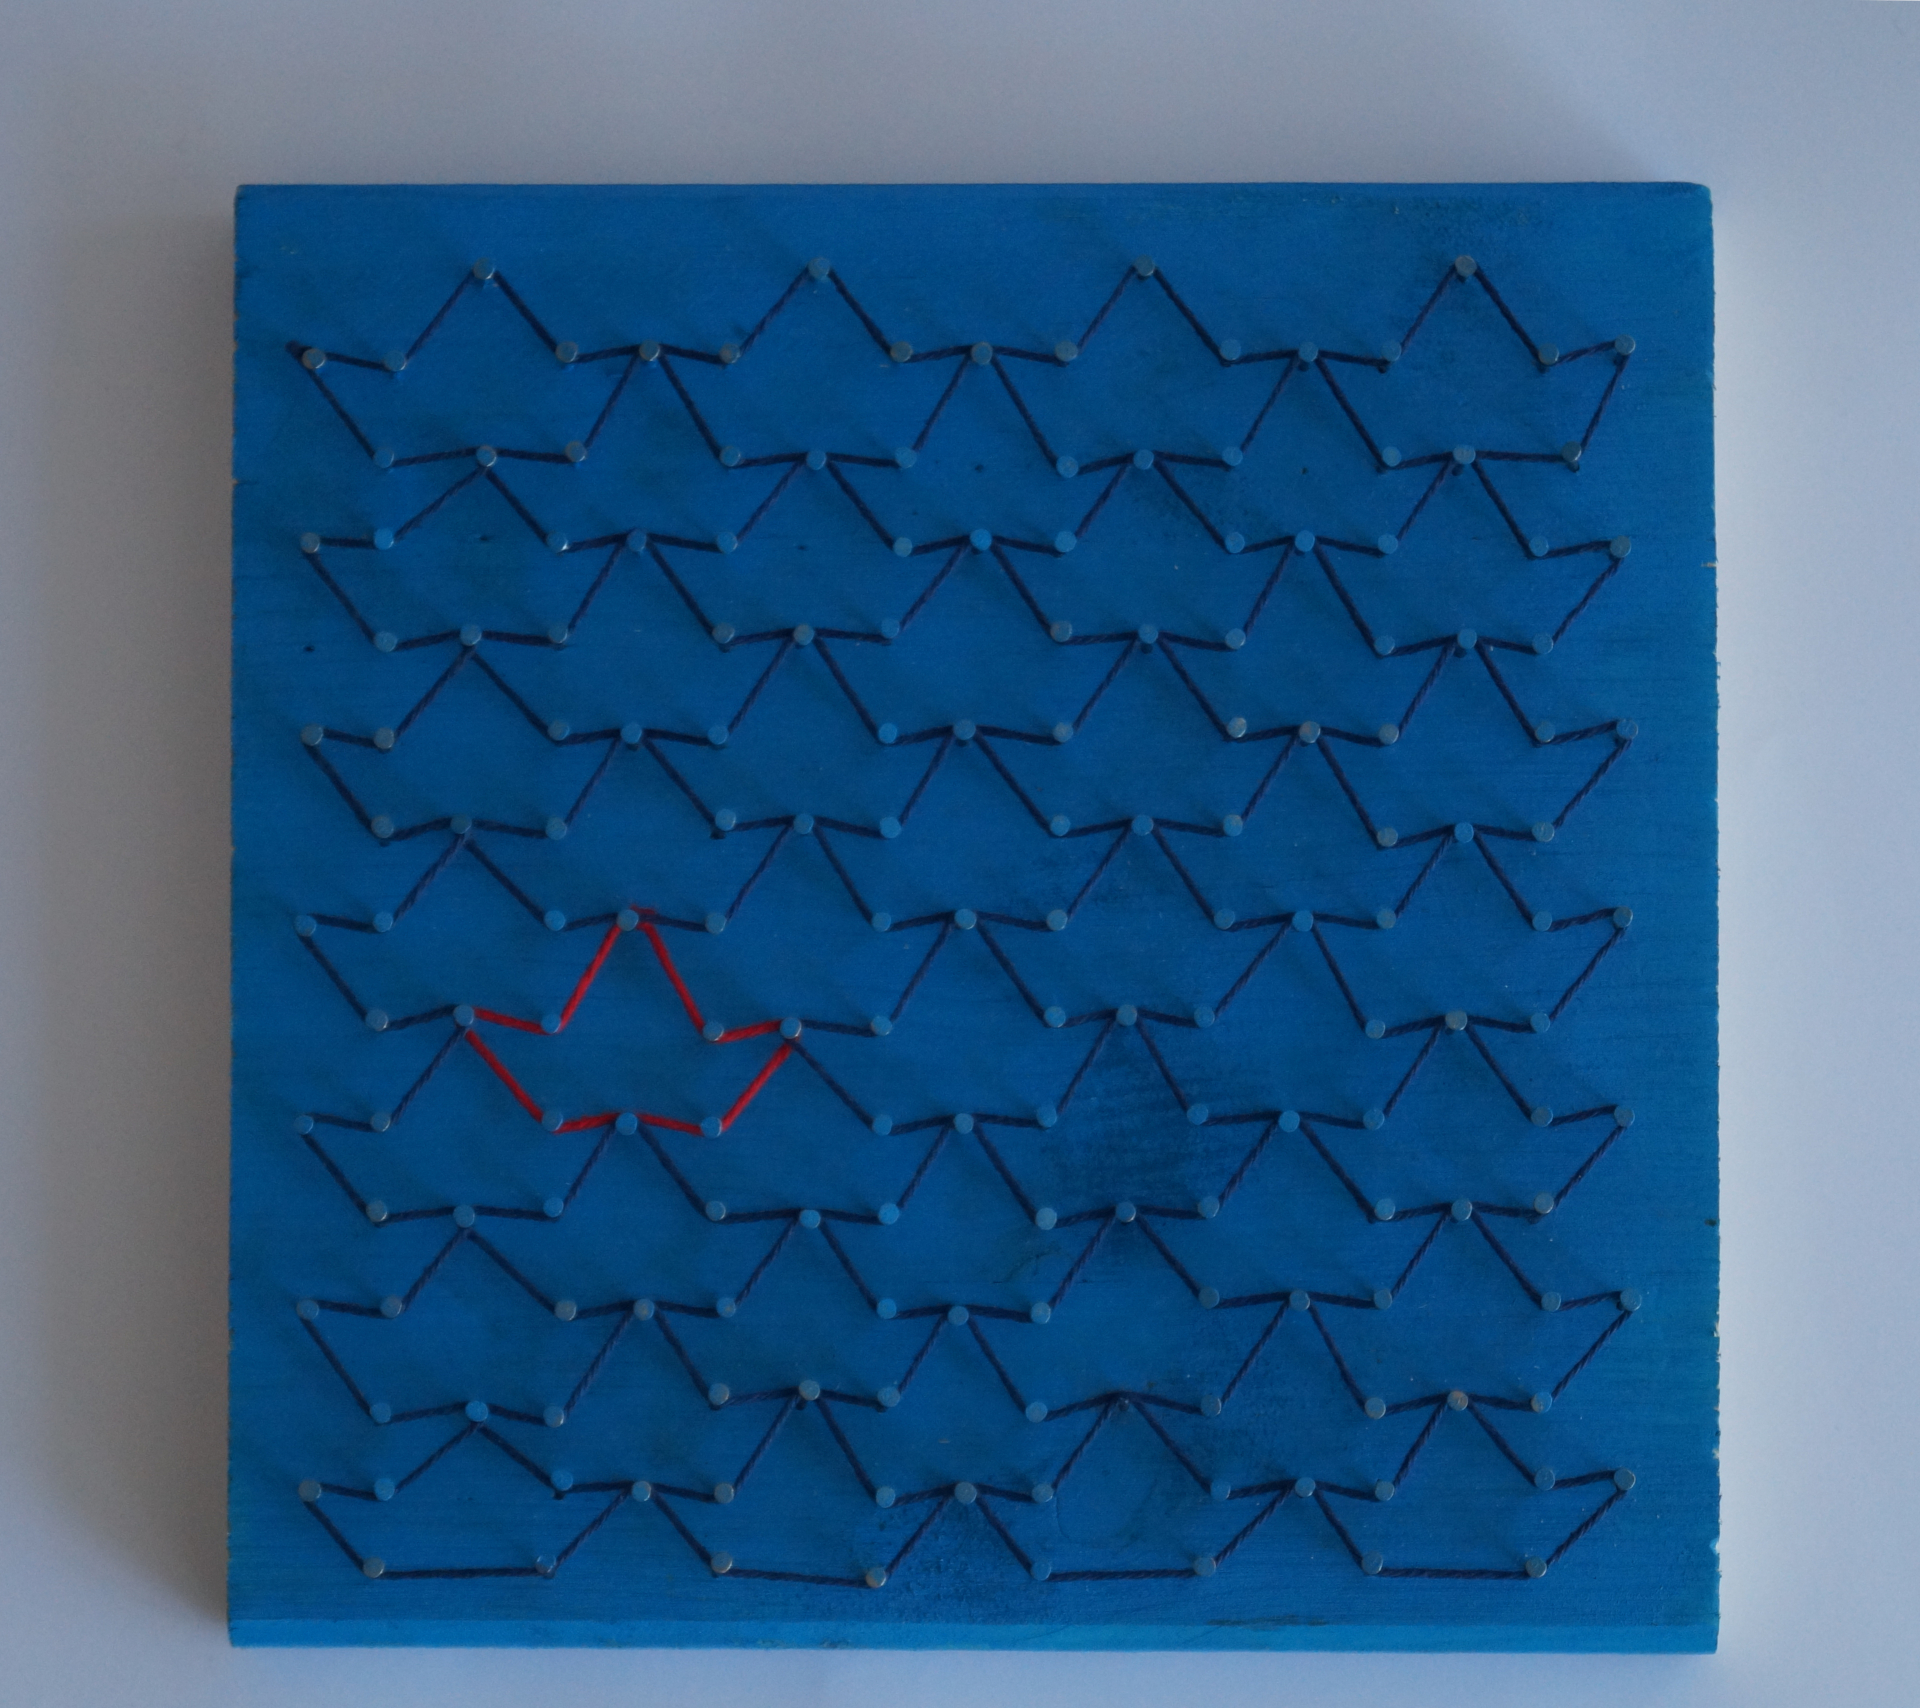
My project is a nail board that represents a mosaic of structures resembling paper boats. I first painted the board (20 cm × 20 cm × 2 cm) with blue acrylic paint and then hammered the 175 nails into the wood in the desired pattern. Then, I connected the nails with a long blue cotton thread and used a red thread for a single boat.
I chose a blue color for the background to mimic the ocean. The thread is a slightly darker blue, so the boats are visible, but still reminiscent of the ocean. The red thread highlights a boat and not only makes it easier to see the structure, but also draws the attention of those looking at it.
Since my nail board is a Euler circle, I took advantage of this feature: it is possible to use exactly one thread for each color and thus connect all the nails correctly and arrive back at the starting point.
Als der Baum dem Walde entsprang (When the tree sprang from the forest)
Josephine Wehner
Ein Baum sagt mehr als tausend Zahlen?! (A tree says more than a thousand numbers?!)
Isabella Kaindl
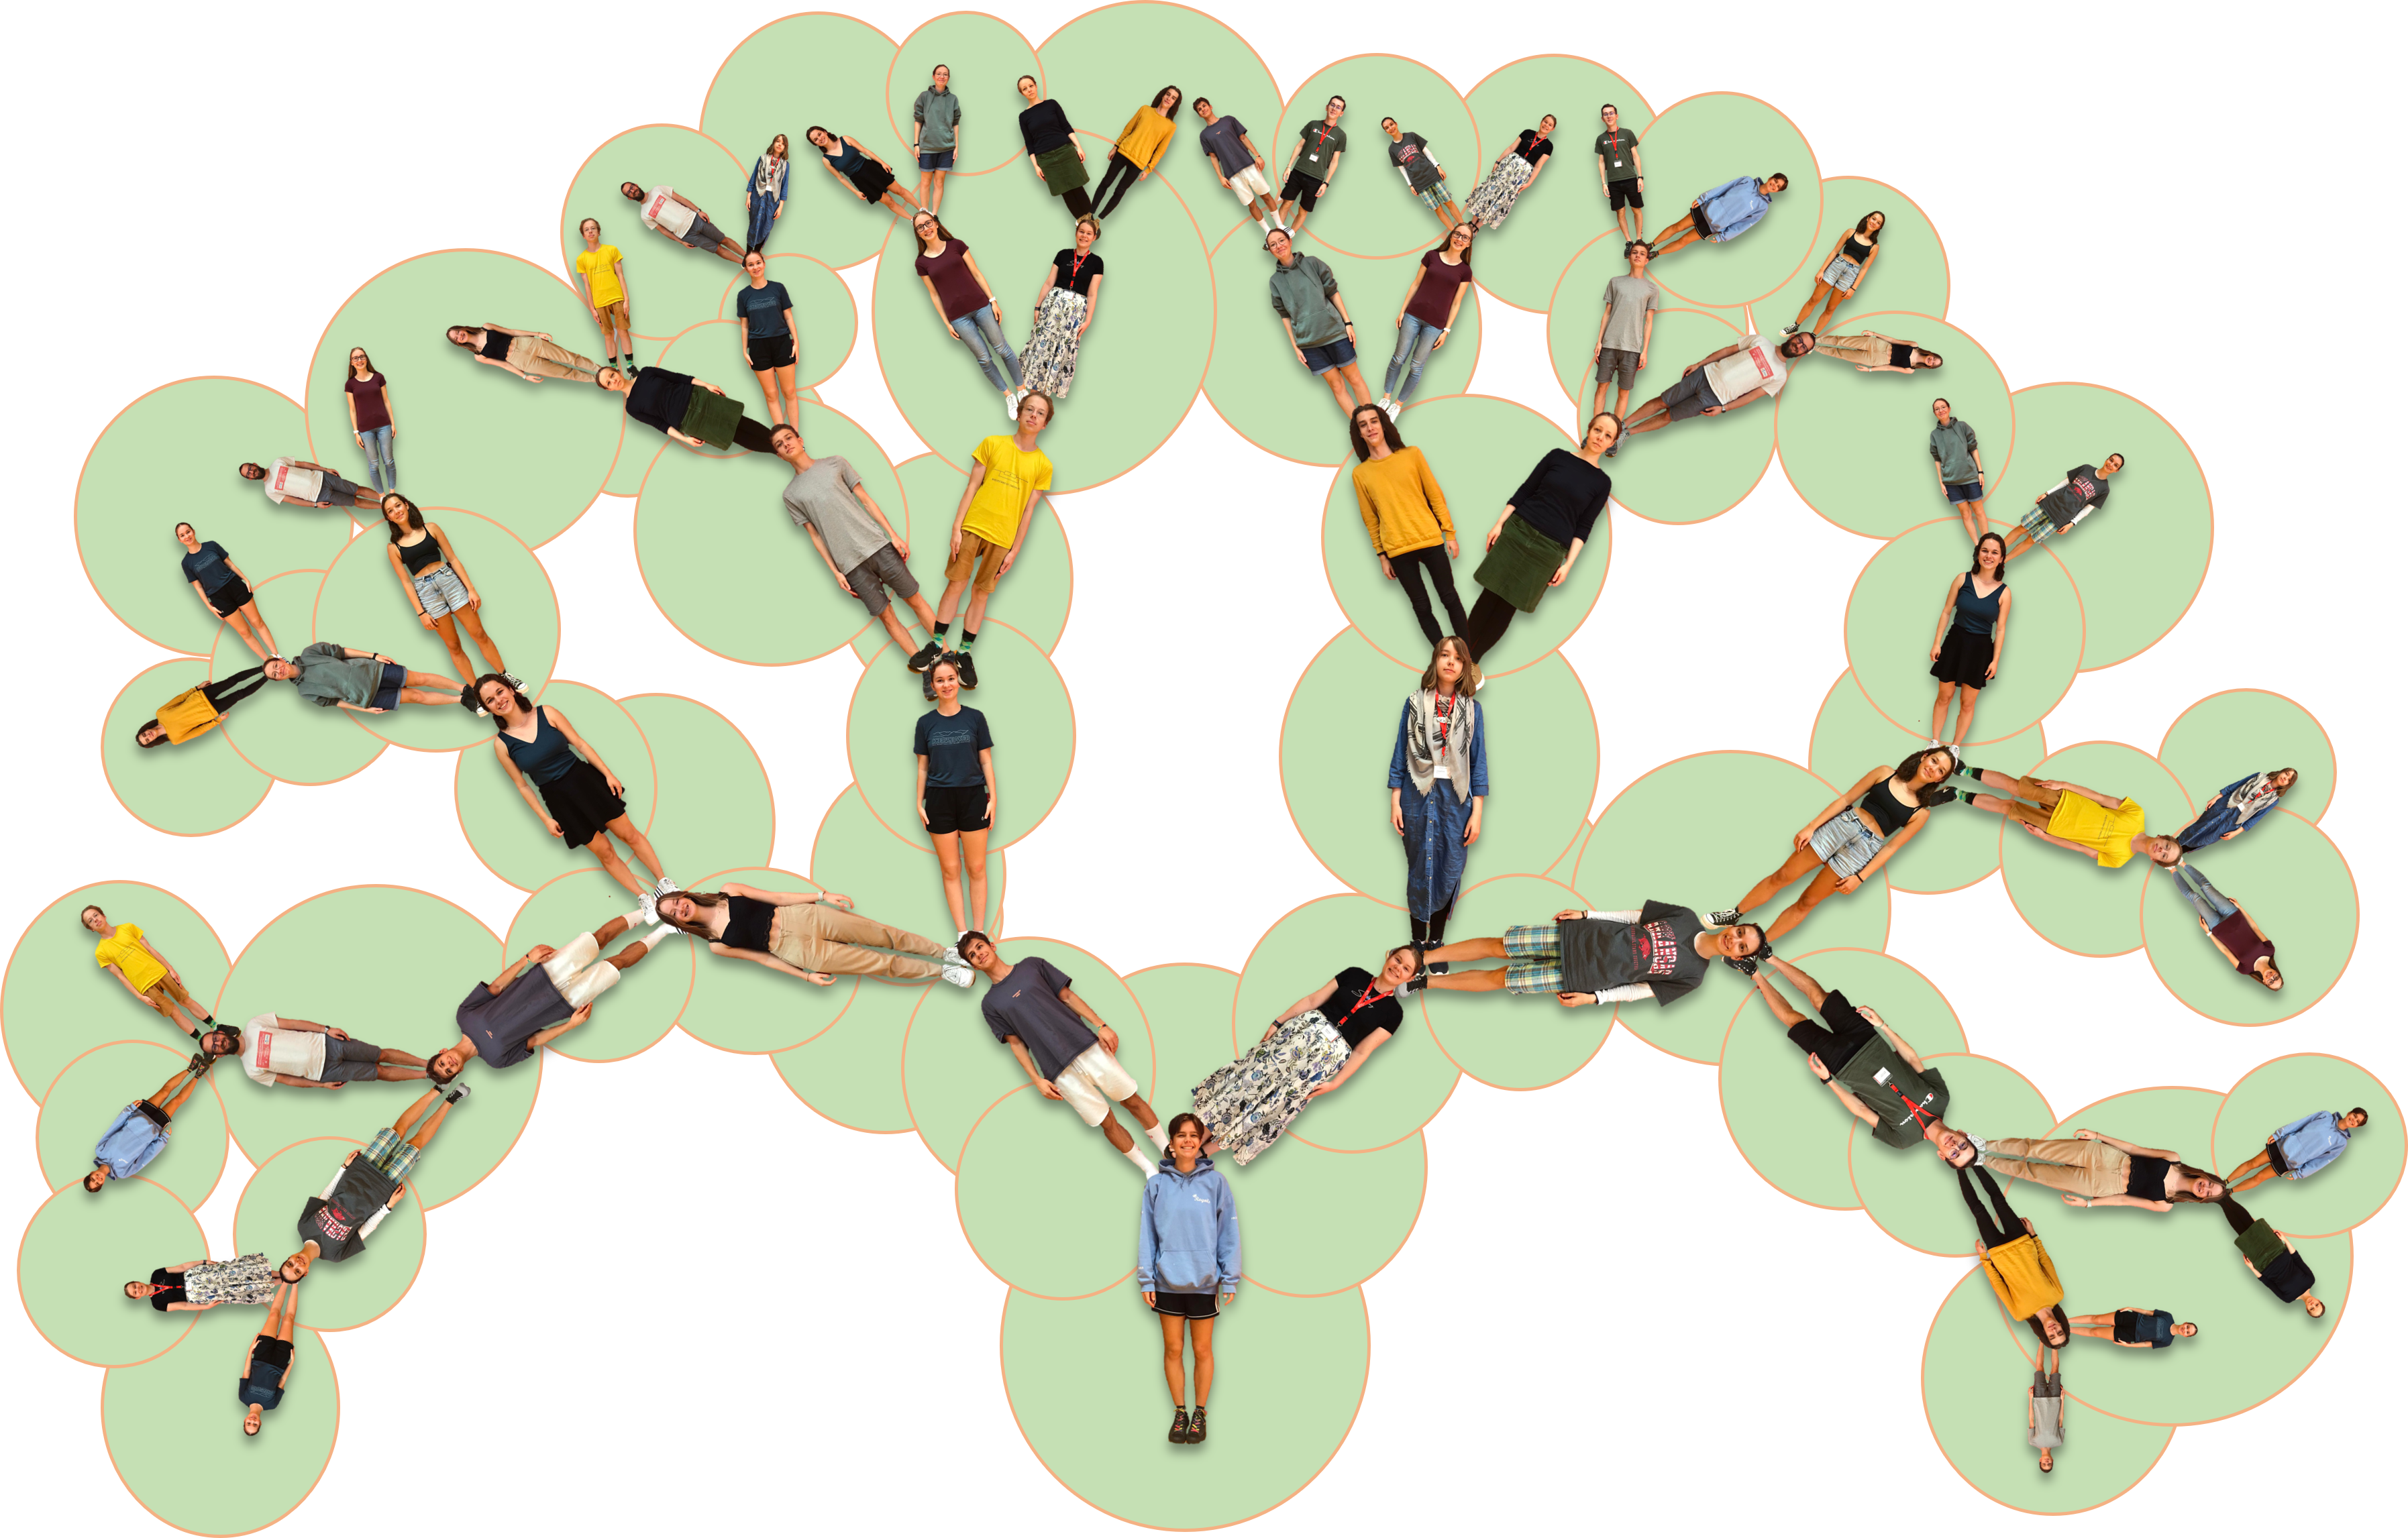
The correct visualization of graphs often leads to problems, because in most cases this can only be achieved by reducing the information. Especially the representation of higher dimensions quickly shows us our limits. However, visualizations also give us many possibilities. This becomes clear for example in my art project. The 63 edges of the binary tree are not represented by simple lines, but by other course participants. For this, I photographed them, cut them out (digitally), and then arranged them as desired. The individuals, already distinguished by their clothing, thereby build up the intrinsically ordered and symmetrical graph. The possible interpretation ideas of this newly created unit seem almost unlimited.
Subsequently, I have extended the tree with green circles in the background to allude to a tree in a biological sense. This makes it clear even for those who have not yet dealt with graph theory, what is to be represented here. Through illustration, I try to make an insight into graph theory through art accessible to everyone. So although a lot of important information can be lost through visualization, I have tried to create a connecting and interdisciplinary work with art through it.